Free Access
Fig. 1
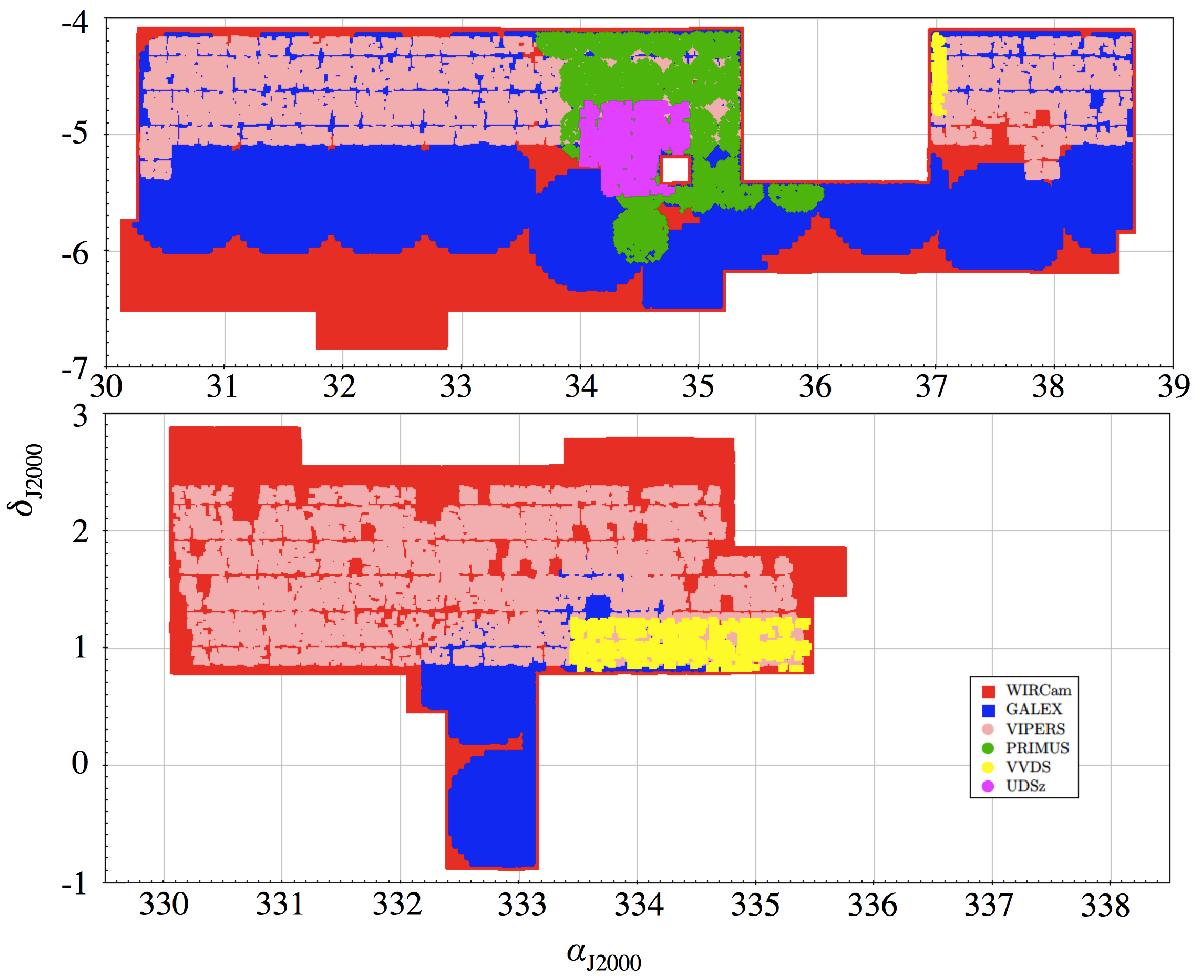
Footprints of the WIRCam Ks-band (red layout and background) and GALEX NUV/FUV (blue circles) observations in the CFHTLS W1 (top) and W4 (bottom) fields. The regions covered by VIPERS (pink), PRIMUS (green), VVDS (yellow) and UDSz (magenta) are over-plotted. The SDSS-BOSS redshifts are distributed over the entire survey.
Current usage metrics show cumulative count of Article Views (full-text article views including HTML views, PDF and ePub downloads, according to the available data) and Abstracts Views on Vision4Press platform.
Data correspond to usage on the plateform after 2015. The current usage metrics is available 48-96 hours after online publication and is updated daily on week days.
Initial download of the metrics may take a while.