Fig. 4
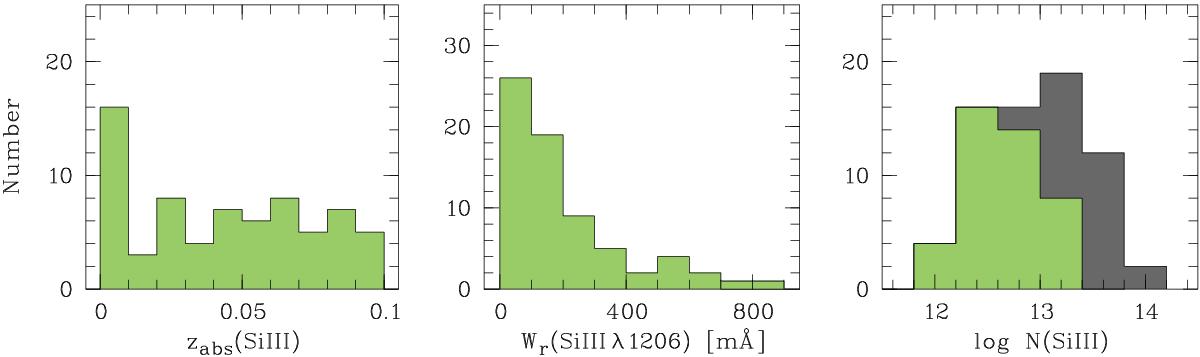
Left panel: redshift distribution of the 69 intervening Si iii absorbers in our sample. Middle panel: distribution of Si iii λ1206 restframe equivalent widths of the 69 absorbers, obtained from the pixel integration over the Si iii velocity profiles. Right panel: distribution of logarithmic Si iii column densities for the 69 absorbers, derived using the AOD method. The gray-shaded area indicates lower limits for log N(Si iii) for absorbers that have saturated Si iii λ1206 lines.
Current usage metrics show cumulative count of Article Views (full-text article views including HTML views, PDF and ePub downloads, according to the available data) and Abstracts Views on Vision4Press platform.
Data correspond to usage on the plateform after 2015. The current usage metrics is available 48-96 hours after online publication and is updated daily on week days.
Initial download of the metrics may take a while.