Fig. 2
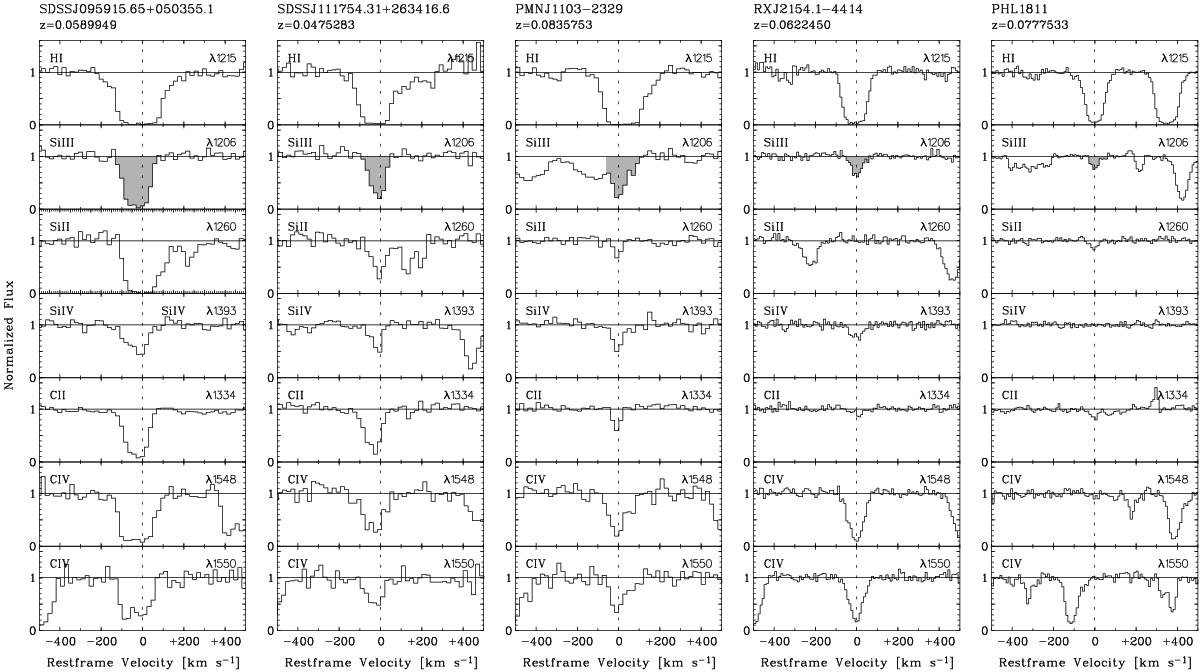
Five examples for velocity profiles of Si iii-selected absorption line systems in our HST/COS survey with decreasing Si iii λ1206 absorption strengths (gray-shaded area; from left to right). Shown are the velocity profiles of H i, Si iii, Si ii, Si iv, C ii, and C iv (from top to bottom) plotted against the absorber’s restframe velocity. The names of the background QSOs and the absorption redshifts are indicated above each panel. A complete set of velocity plots for all detected Si iii absorbers discussed in this paper is available in the Appendix.
Current usage metrics show cumulative count of Article Views (full-text article views including HTML views, PDF and ePub downloads, according to the available data) and Abstracts Views on Vision4Press platform.
Data correspond to usage on the plateform after 2015. The current usage metrics is available 48-96 hours after online publication and is updated daily on week days.
Initial download of the metrics may take a while.