Free Access
Fig. 7
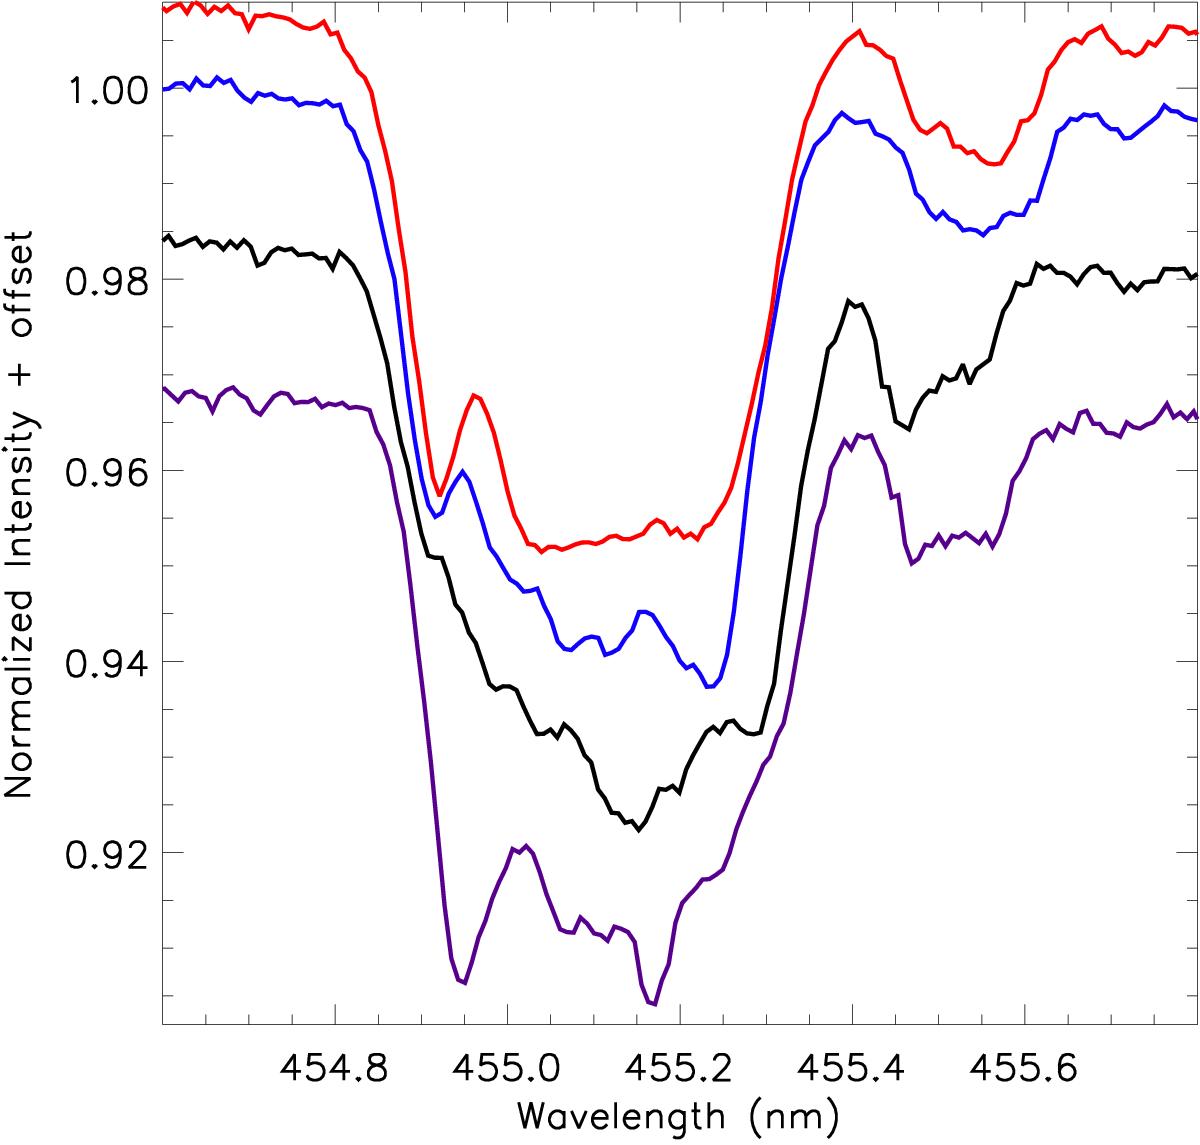
Si III 4552 Å absorption arising in m1 (left) and in m2 (right) in spectra obtained in 2013 in the phase interval 0.82–0.88. Note the varying shape of both the m1 and m2 absorption lines. From bottom to top: May 30 (φ = 0.854), May 18 (φ = 0.877), June 19 (φ = 0.822) and June 23 (φ = 0.826).
Current usage metrics show cumulative count of Article Views (full-text article views including HTML views, PDF and ePub downloads, according to the available data) and Abstracts Views on Vision4Press platform.
Data correspond to usage on the plateform after 2015. The current usage metrics is available 48-96 hours after online publication and is updated daily on week days.
Initial download of the metrics may take a while.