Fig. 5
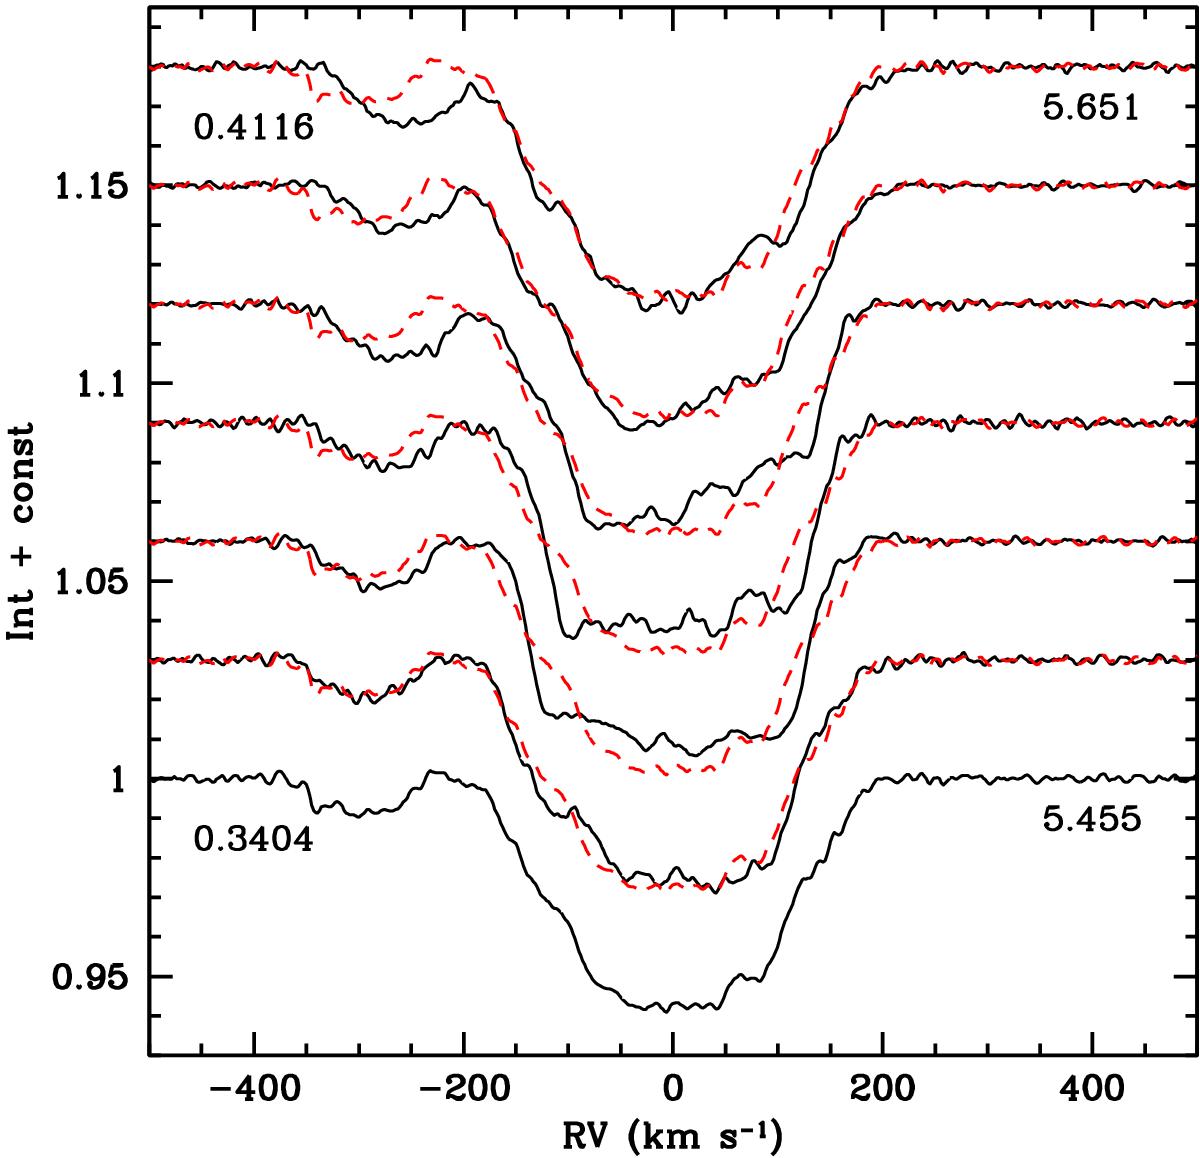
Over a timespan of 4.7 h the shape of m1’s line cycles from paraboloid, to flat-bottomed, to sloping upward towards the blue and then approaching once again the paraboloid shape. Time runs from bottom to top in units of days and is indicated on the right side. The corresponding orbital phase is listed on the left. The profile shown with dashes is always the same one (φ = 0.34). The profile of m2 appears here at −280 km s-1.
Current usage metrics show cumulative count of Article Views (full-text article views including HTML views, PDF and ePub downloads, according to the available data) and Abstracts Views on Vision4Press platform.
Data correspond to usage on the plateform after 2015. The current usage metrics is available 48-96 hours after online publication and is updated daily on week days.
Initial download of the metrics may take a while.