Fig. 4
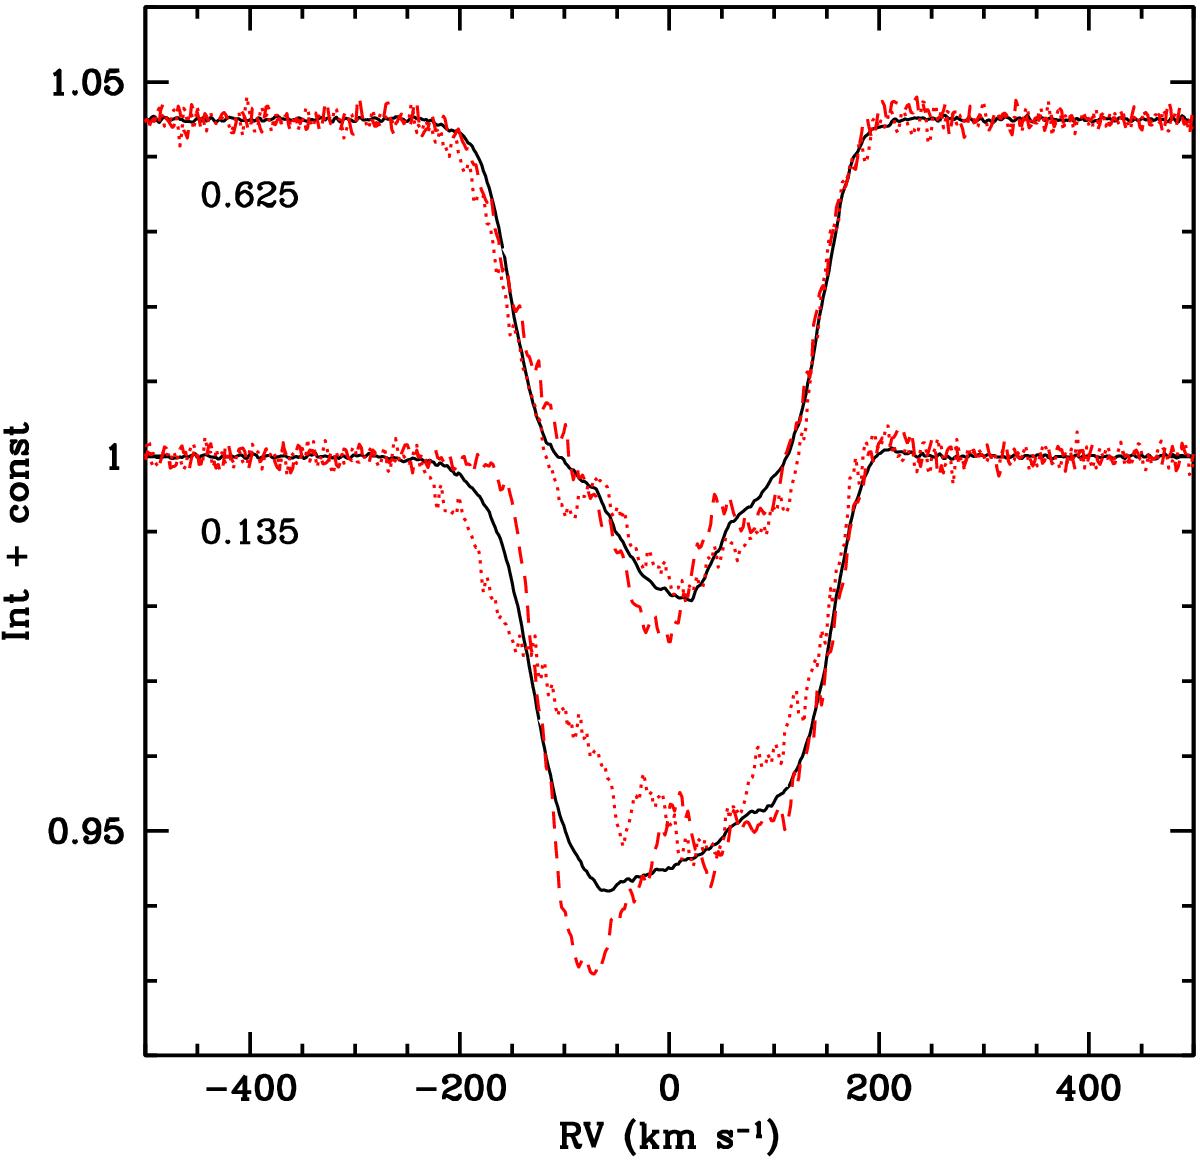
Average line profile at both conjunctions (continuous line) is compared with the first (dash) and the last (dots) of the individual 5-spectrum averages of the same night, illustrating that the spectra at these orbital phases are all broader than near elongations. The significantly different profile at ⟨ φ ⟩ = 0.135 is caused by the presence of m2 having moved from near the core of m1’s absorption to its wing over the ~7 h that these observations lasted. The rapid motion is due to the fact that this phase is just after periastron.
Current usage metrics show cumulative count of Article Views (full-text article views including HTML views, PDF and ePub downloads, according to the available data) and Abstracts Views on Vision4Press platform.
Data correspond to usage on the plateform after 2015. The current usage metrics is available 48-96 hours after online publication and is updated daily on week days.
Initial download of the metrics may take a while.