Fig. 3
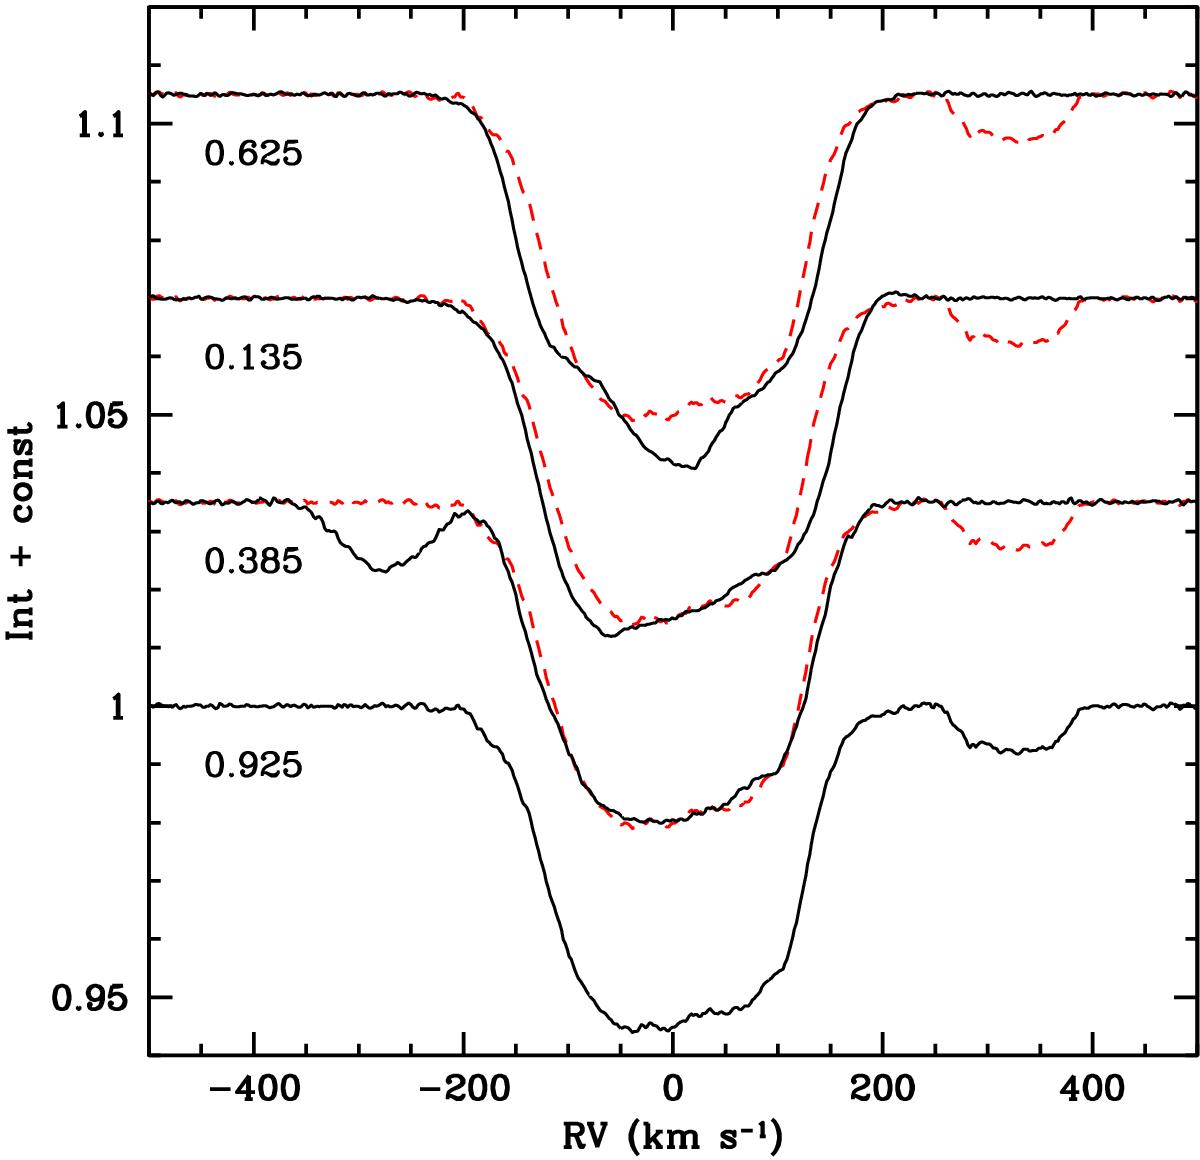
Average profiles for each night in the 2000 data plotted on a velocity scale corrected for the measured RVs of m1. A constant vertical shift is applied for clarity in this figure. The average orbital phase for the night is shown. The spectrum at ⟨ φ ⟩ = 0.925 is re-plotted (dashes) for comparison with the others, and shows that the line-profile near conjunctions (⟨ φ ⟩ = 0.135 and 0.625) is broader than near elongations (⟨ φ ⟩ = 0.925, 0.385).
Current usage metrics show cumulative count of Article Views (full-text article views including HTML views, PDF and ePub downloads, according to the available data) and Abstracts Views on Vision4Press platform.
Data correspond to usage on the plateform after 2015. The current usage metrics is available 48-96 hours after online publication and is updated daily on week days.
Initial download of the metrics may take a while.