Fig. A.4
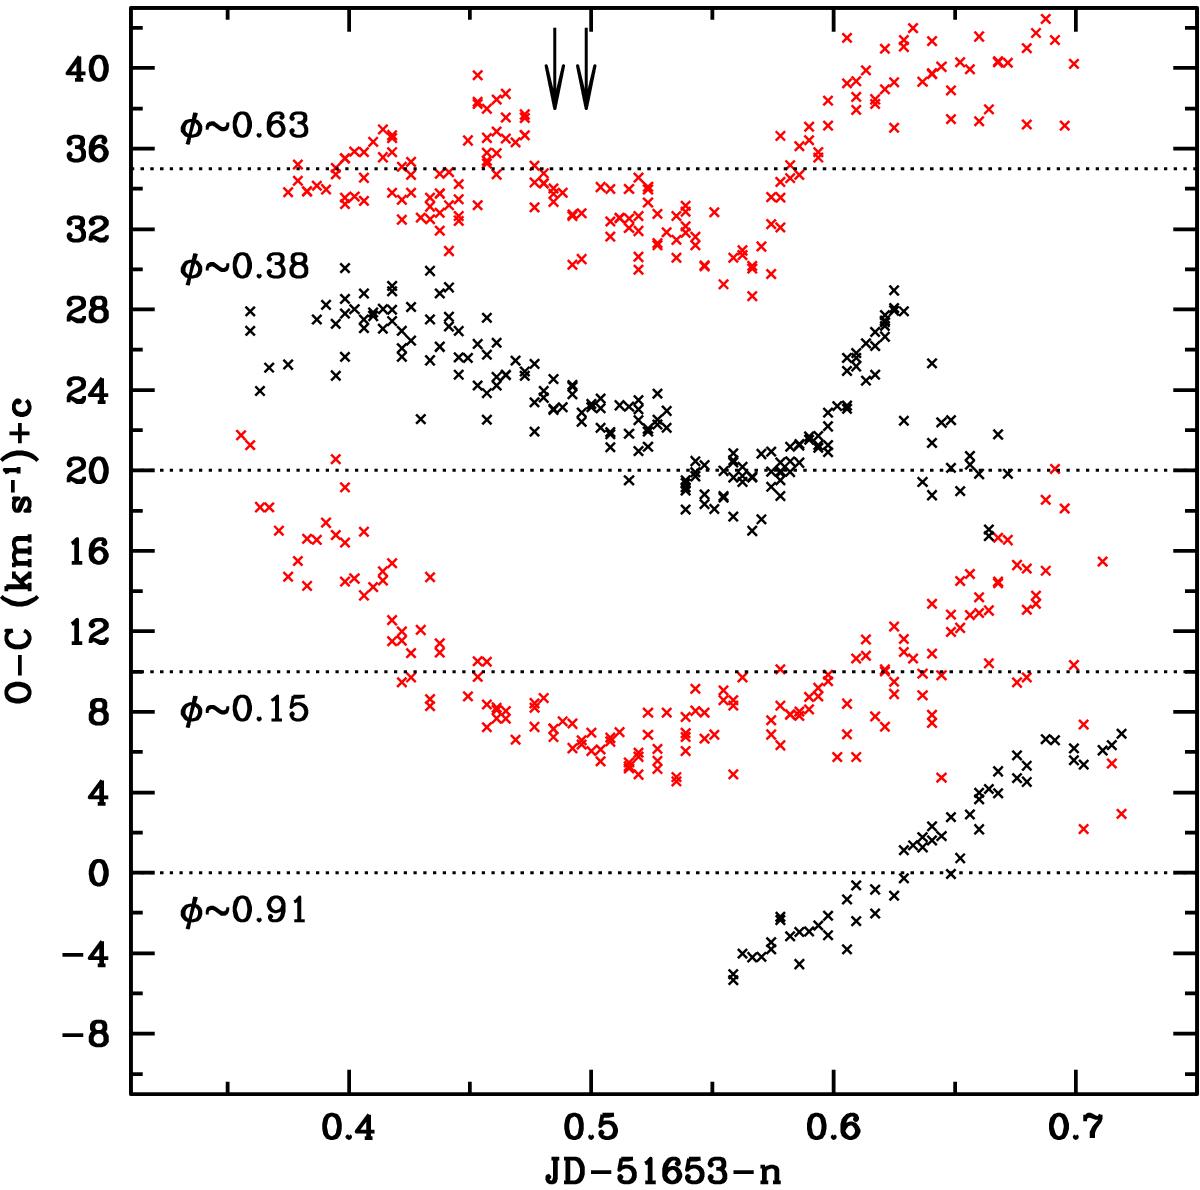
Values of O–C from the m1 SOFIN RV curve of Si III 4552 Å, using the best-fit obtained with FOTEL. From bottom to top, the sets correspond to JD–2 445 543-n, with n = 0,1,2,3, and each set is shifted along the vertical axis by, respectively, c = 0, 10, 20, 35 km s-1, which is indicated by the horizontal lines. The mean orbital phase is indicated, and the arrows point to the two possible times of conjunction when m2 is in back of m1 (see Tables 3 and 4).
Current usage metrics show cumulative count of Article Views (full-text article views including HTML views, PDF and ePub downloads, according to the available data) and Abstracts Views on Vision4Press platform.
Data correspond to usage on the plateform after 2015. The current usage metrics is available 48-96 hours after online publication and is updated daily on week days.
Initial download of the metrics may take a while.