Fig. A.3
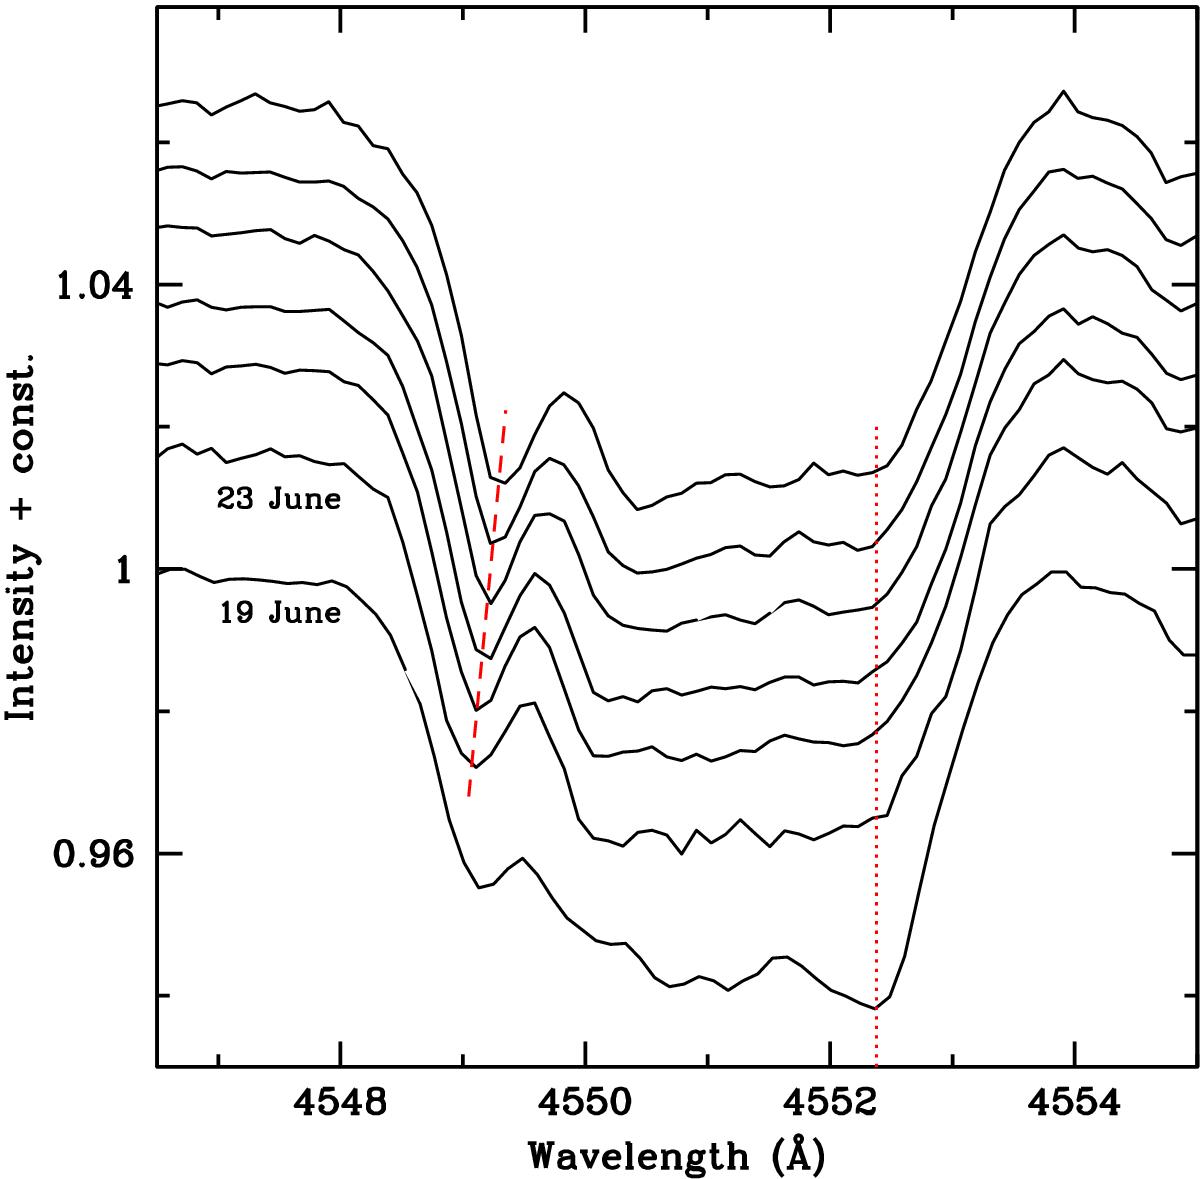
Si III 4552 Å absorption line in m1 observed on 2013 June 23 over a 47 min timespan (phases 0.818–0.826), and the profile of 2013 June 19 (phase 0.822), stacked in order of increasing time from bottom to top. The prominent blue “bump” that migrates from the left absorption wing toward line center is illustrated with the dash line and the quasi-stationary “red spike” with the dotted line. Note the stronger “red spike” on the June 19 profile.
Current usage metrics show cumulative count of Article Views (full-text article views including HTML views, PDF and ePub downloads, according to the available data) and Abstracts Views on Vision4Press platform.
Data correspond to usage on the plateform after 2015. The current usage metrics is available 48-96 hours after online publication and is updated daily on week days.
Initial download of the metrics may take a while.