Fig. A.1
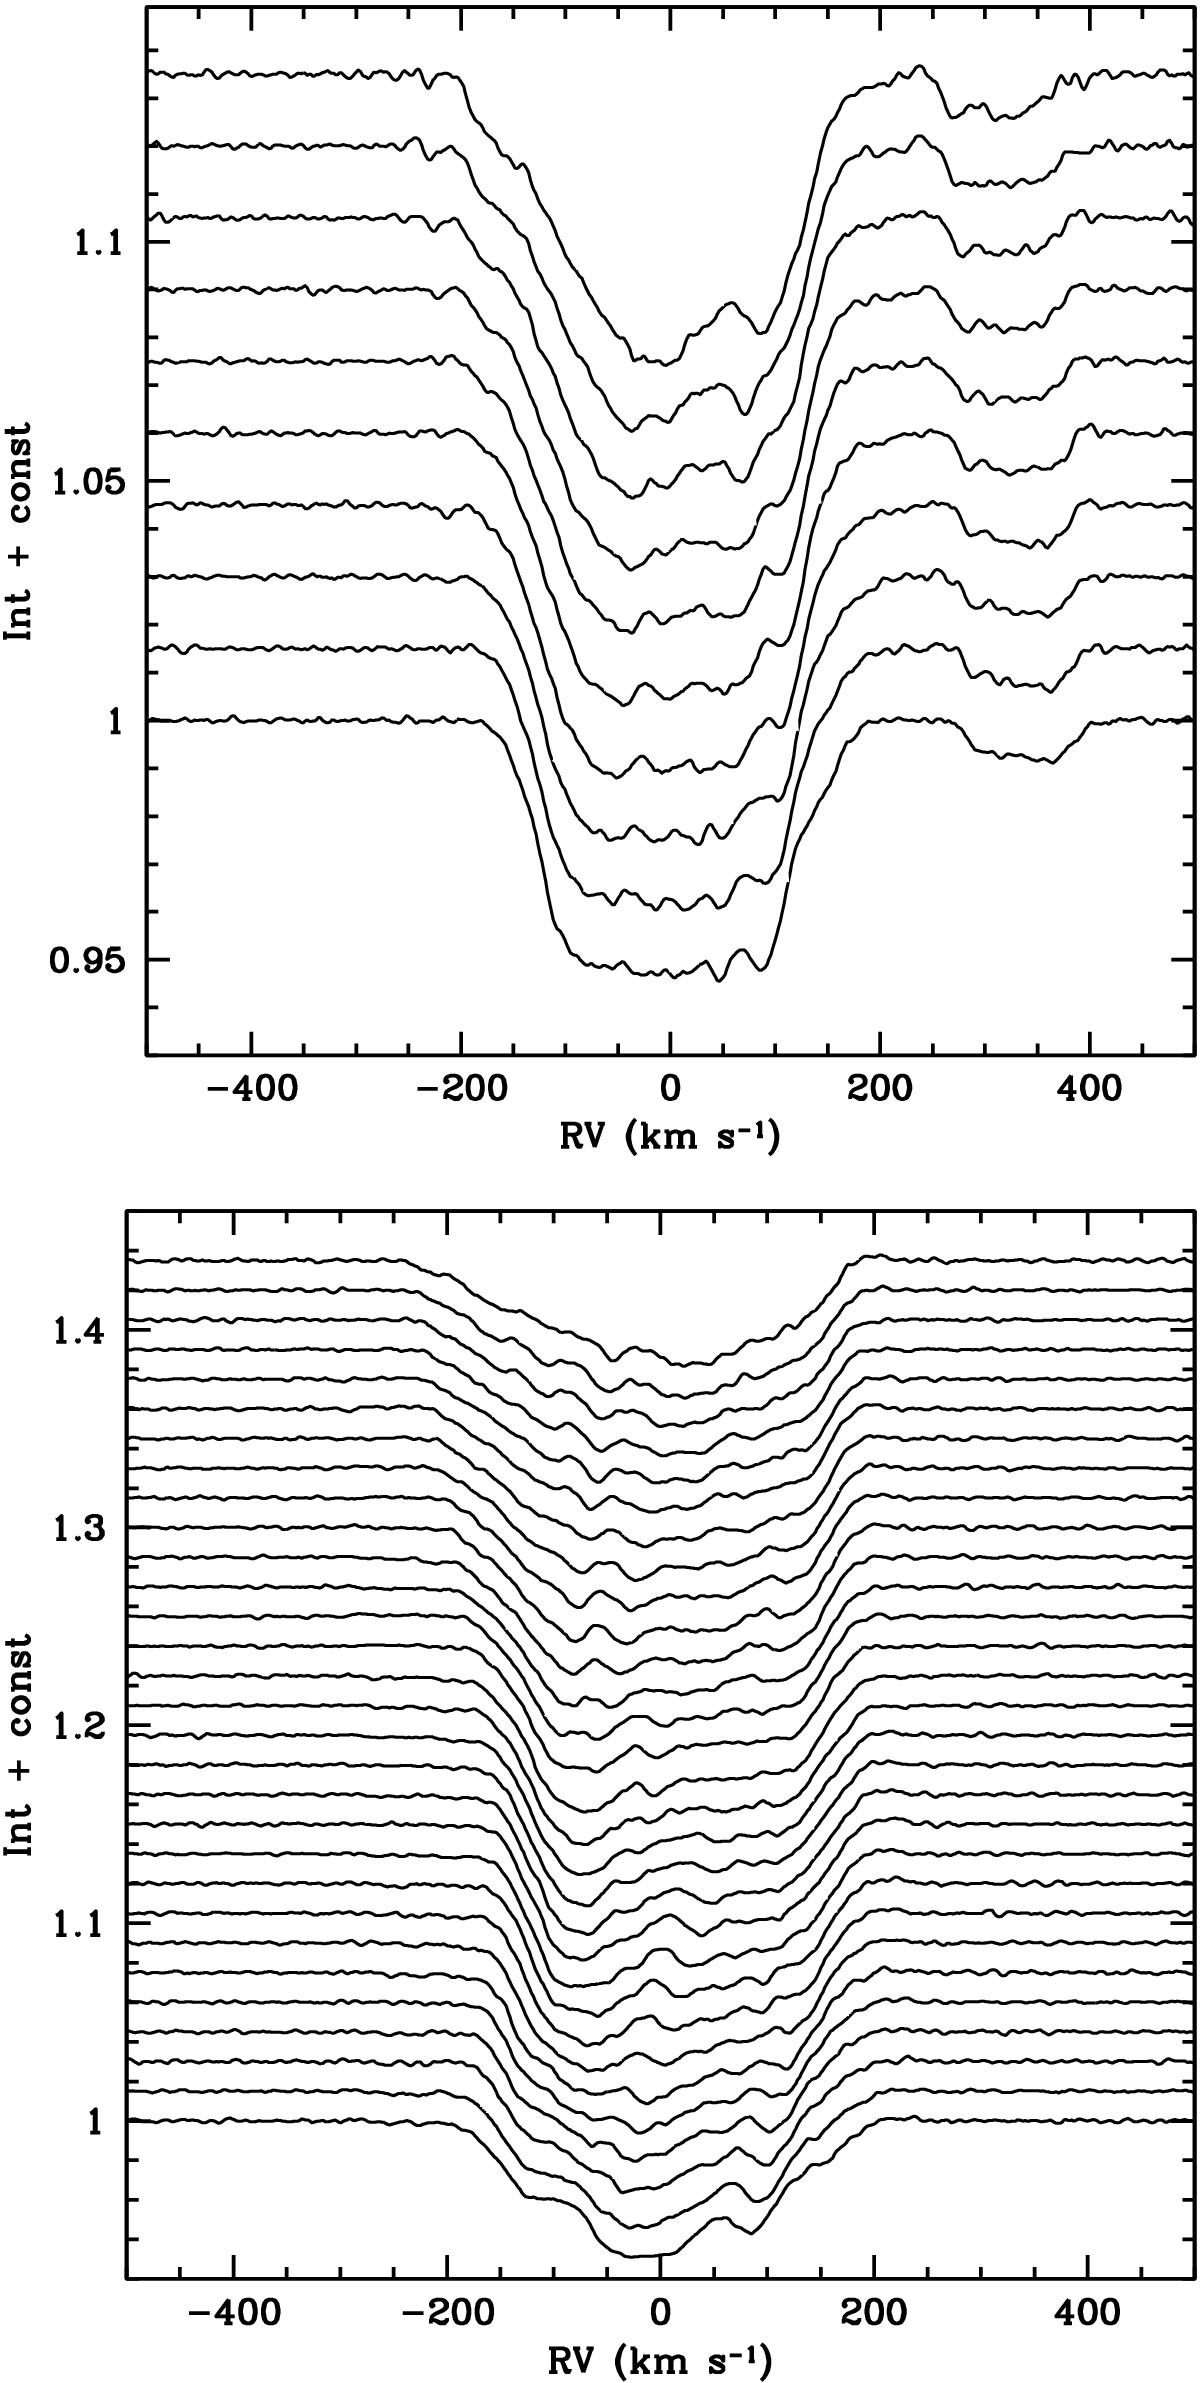
Top: Si III 4552 line profiles obtained on JD 2 451 653 over a timespan of 3.9 h (orbital phases 0.890–0.927), showing the emergence of the quasi-centrally-located dip in the profile of m1. The profile of m2 is located at approximately +325 km s-1, and displays the gradual appearance of a “blue spike”. Time increases from bottom to top. Bottom: sequence of profiles obtained on 2 451 655 over a timespan of 7.5 h (orbital phases 0.338–0.416). In this case, the line due to m2 is initially at around −25 km s-1 and marches blueward over the course of the night, appearing near the continuum in the very extended blue wing of m1 by the end of the night.
Current usage metrics show cumulative count of Article Views (full-text article views including HTML views, PDF and ePub downloads, according to the available data) and Abstracts Views on Vision4Press platform.
Data correspond to usage on the plateform after 2015. The current usage metrics is available 48-96 hours after online publication and is updated daily on week days.
Initial download of the metrics may take a while.