Fig. 14
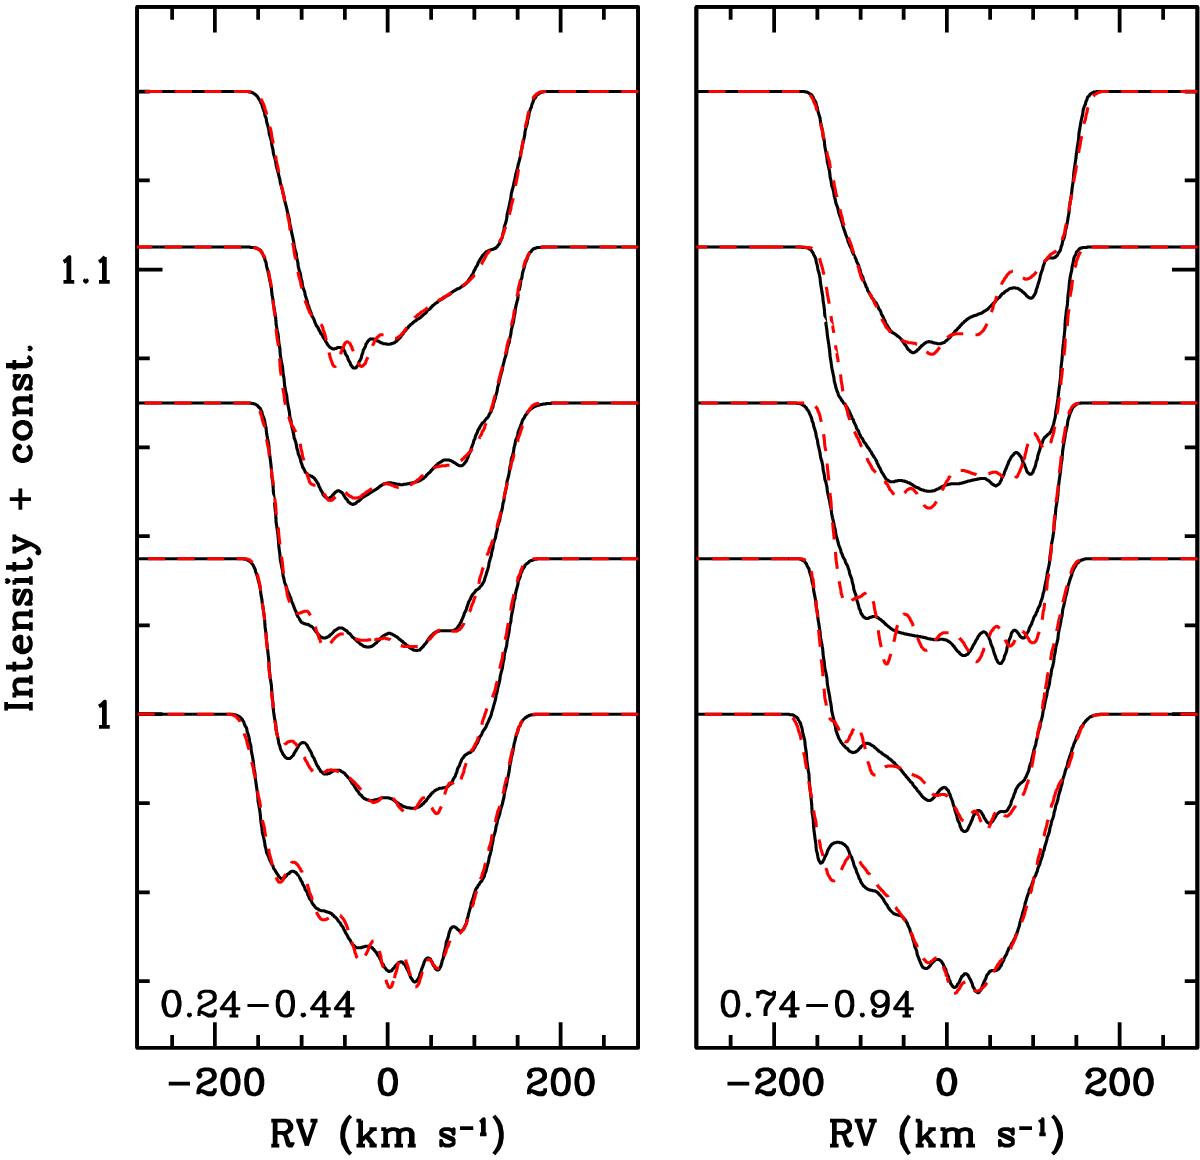
Theoretical line profiles for m1 with R1 = 7.6R⊙ and 8.4 R⊙ (dash) in the orbital phase intervals 0.24–0.44 and 0.74–0.94 for ωper = 233°. The orbital phases run from bottom to top, as indicated. Note that the most significant differences between the profiles of different radii is in the “bumps” as the star approaches periastron (right).
Current usage metrics show cumulative count of Article Views (full-text article views including HTML views, PDF and ePub downloads, according to the available data) and Abstracts Views on Vision4Press platform.
Data correspond to usage on the plateform after 2015. The current usage metrics is available 48-96 hours after online publication and is updated daily on week days.
Initial download of the metrics may take a while.