Fig. 13
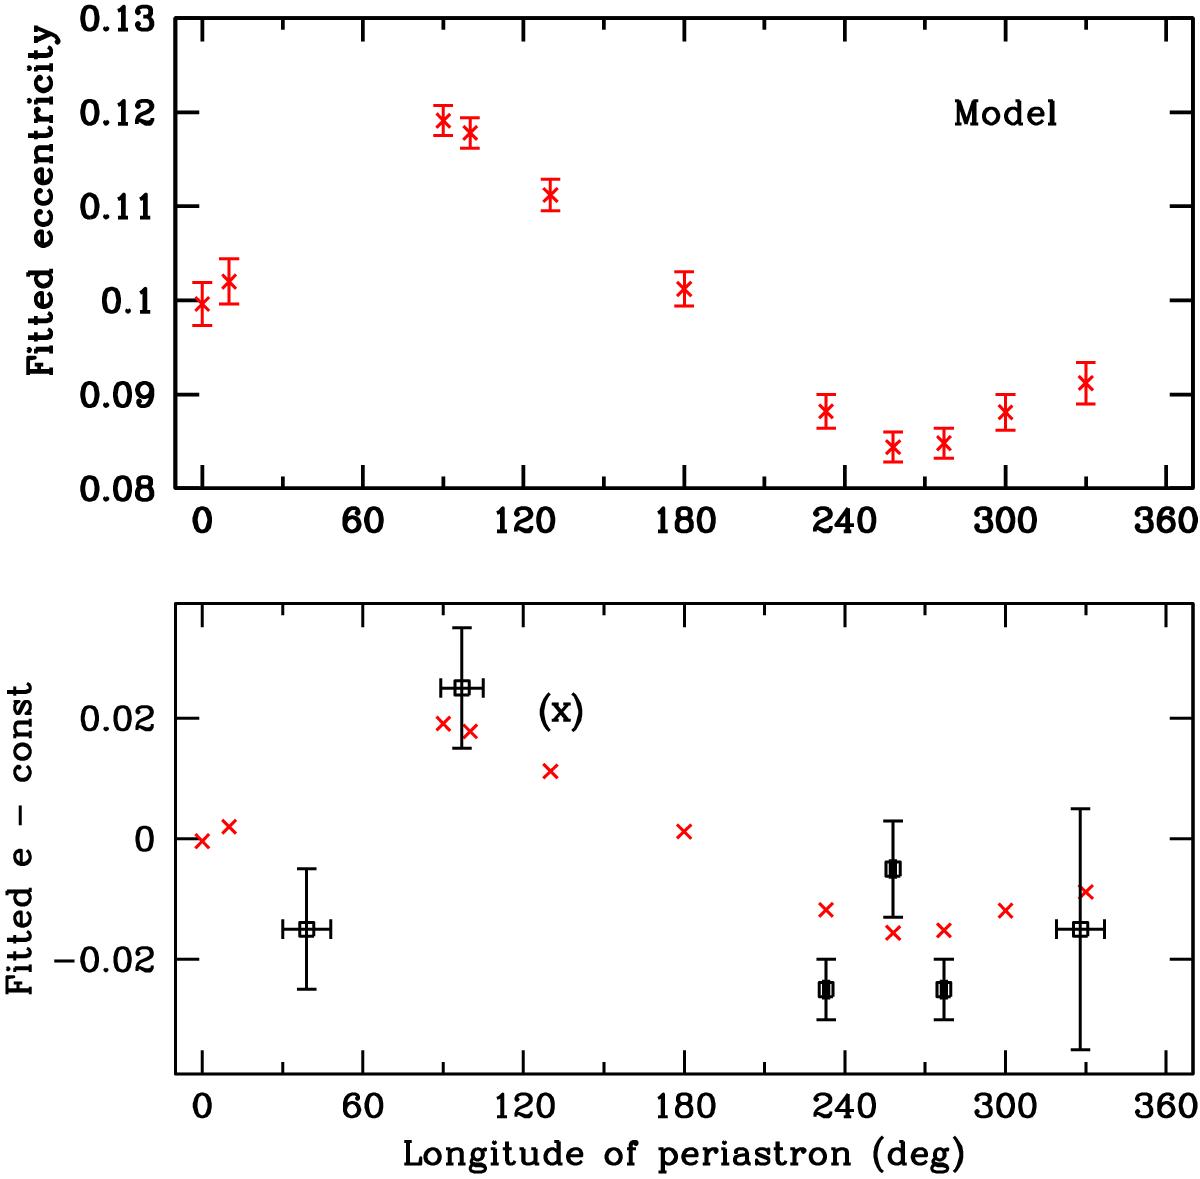
Top: eccentricity fitted by SBCM (Morbey & Brosterhus 1974) using the RVs measured on the theoretical, tidally-perturbed line profiles of m1 as a function of the longitude of periastron. The calculations were all performed with e = 0.1. The error bars are the uncertainties given by the RV curve fitting routine. Bottom: the crosses are the fitted eccentricities shown in the top panel after subtracting the actual value e = 0.1. The squares are the historic e values quoted by Shobbrook et al. (1972) and the values we have derived in this paper, after subtracting the mid-point value e = 0.125. The value in parenthesis is the one given in Herbison-Evans et al. (1971). The error bars represent the corresponding quoted uncertainties.
Current usage metrics show cumulative count of Article Views (full-text article views including HTML views, PDF and ePub downloads, according to the available data) and Abstracts Views on Vision4Press platform.
Data correspond to usage on the plateform after 2015. The current usage metrics is available 48-96 hours after online publication and is updated daily on week days.
Initial download of the metrics may take a while.