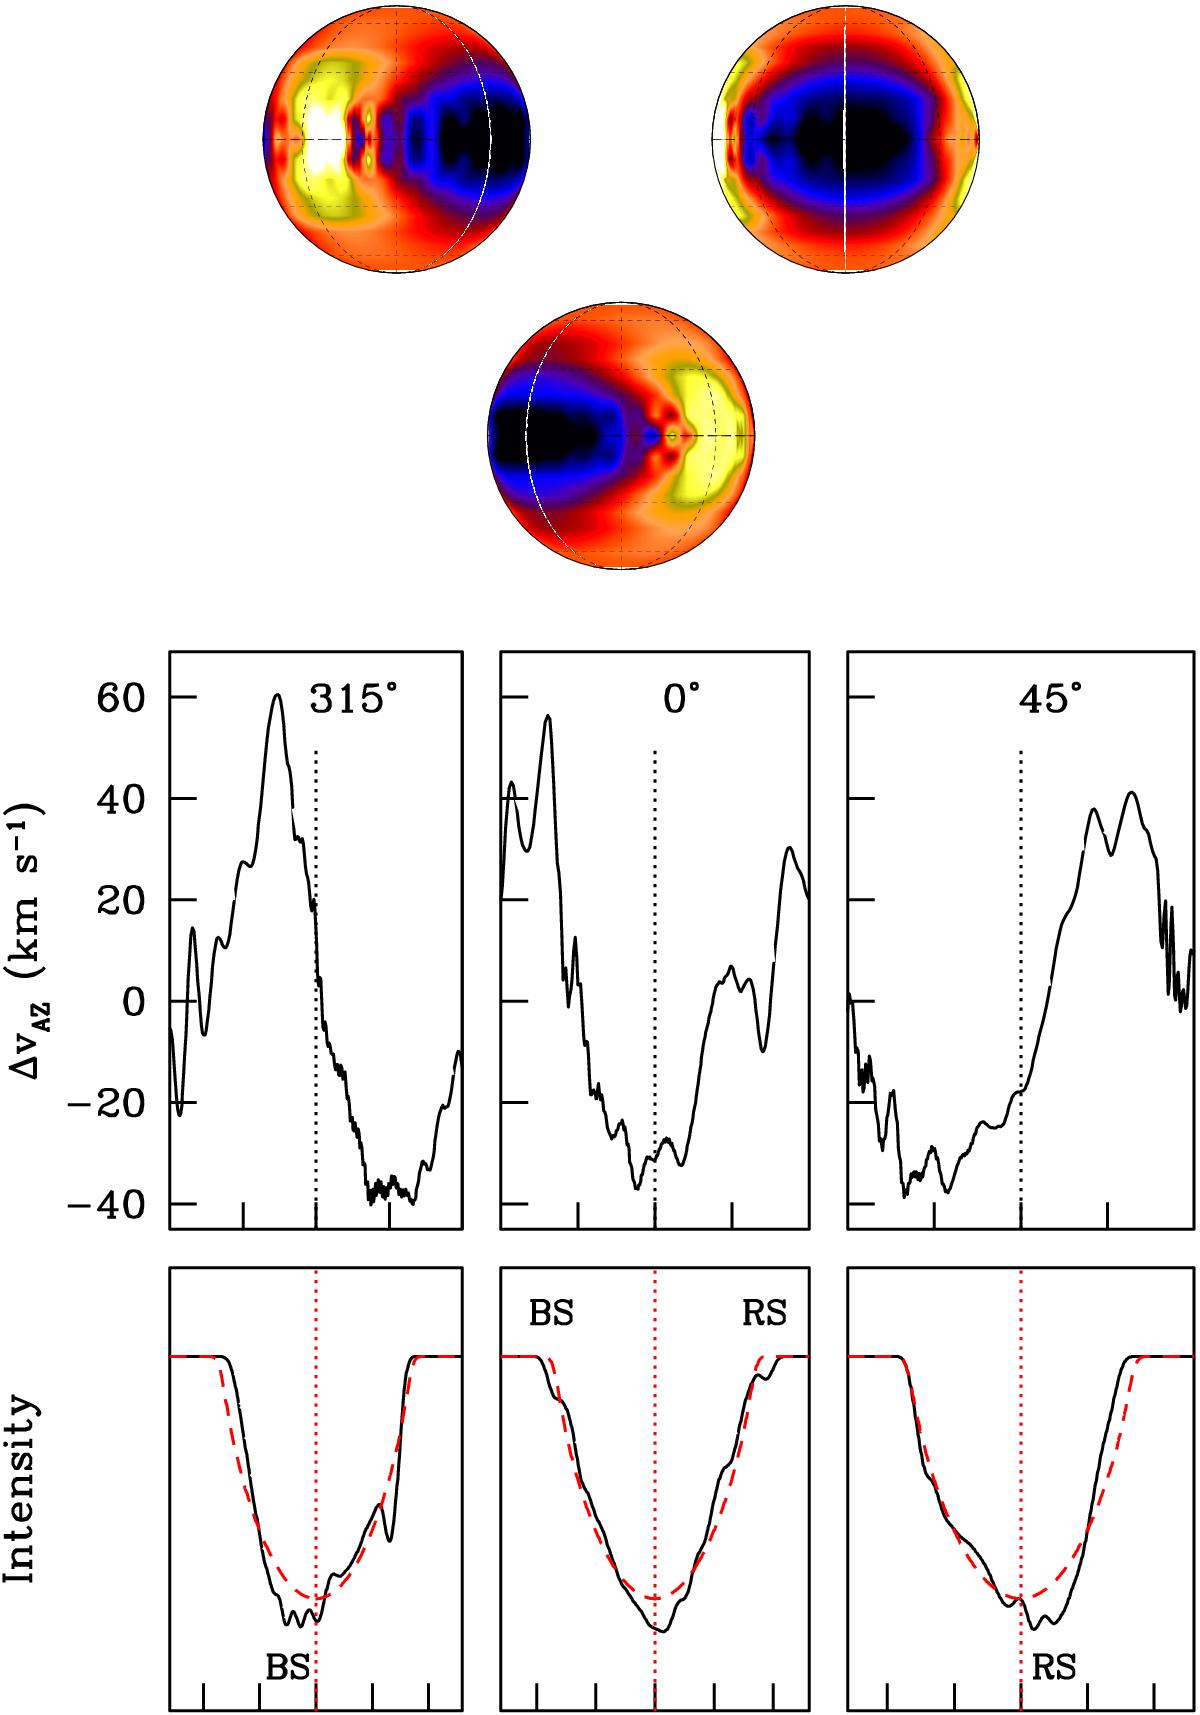
Fig. 11

Top: residual surface horizontal velocity field, ΔvAZ, on the hemisphere that would be seen by an observer around the time of conjunction when m2 is in front of m1 for the R1 = 7.6 R⊙, e = 0.1 calculation and for the epoch 2000, when ωper = 233°. From right to left: half a day before conjunction (φ = 0.494), at conjunction (φ = 0.619) and half a day after (φ = 0.750). The maps are centered, respectively, on longitudes ϕ = 45°, 0°, 315°. The sub-binary longitude is shown by the white dotted line that crosses the dark patch. The sense of rotation is such that the left limb is approaching the observer; i.e., rotation is counterclockwise when viewed from the north pole, and so is the orbital motion. Darkest patches correspond to tidal flows with ΔvAZ< 0 and lightest patches to ΔvAZ> 0. Middle: ΔvAZ along the equator corresponding to the maps above. The ordinate is in units of km s-1. The tick marks in the abscissa are set at 45° intervals with the central longitude indicated with the dotted line. Bottom: corresponding line profiles compared with the non-perturbed line profiles (dash). The dotted line indicates the zero velocity and the ticks are separated by 100 km s-1. BS and RS indicate the blue and red spikes.
Current usage metrics show cumulative count of Article Views (full-text article views including HTML views, PDF and ePub downloads, according to the available data) and Abstracts Views on Vision4Press platform.
Data correspond to usage on the plateform after 2015. The current usage metrics is available 48-96 hours after online publication and is updated daily on week days.
Initial download of the metrics may take a while.


