Free Access
Fig. 10
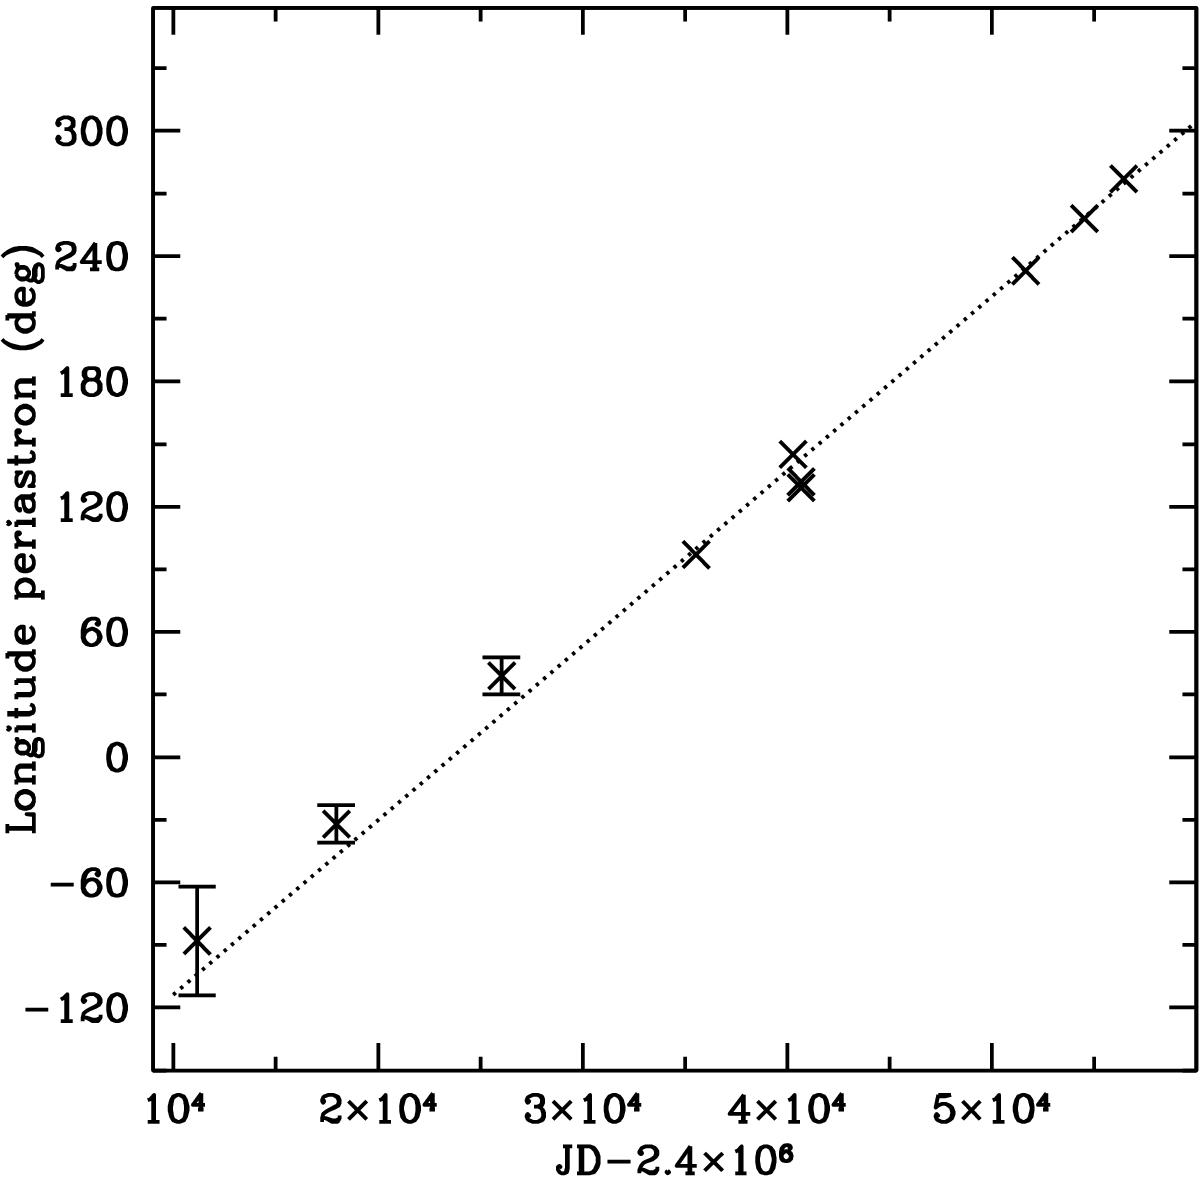
Values of the longitude of periastron (ωper) as a function of epoch of observation (see Table 5). The line is a linear fit to the data. The error bars for the years 1956, 1969 and 1970 are the size of the symbols and they are smaller than the symbols for 2000, 2008 and 2013.
Current usage metrics show cumulative count of Article Views (full-text article views including HTML views, PDF and ePub downloads, according to the available data) and Abstracts Views on Vision4Press platform.
Data correspond to usage on the plateform after 2015. The current usage metrics is available 48-96 hours after online publication and is updated daily on week days.
Initial download of the metrics may take a while.