Fig. 5
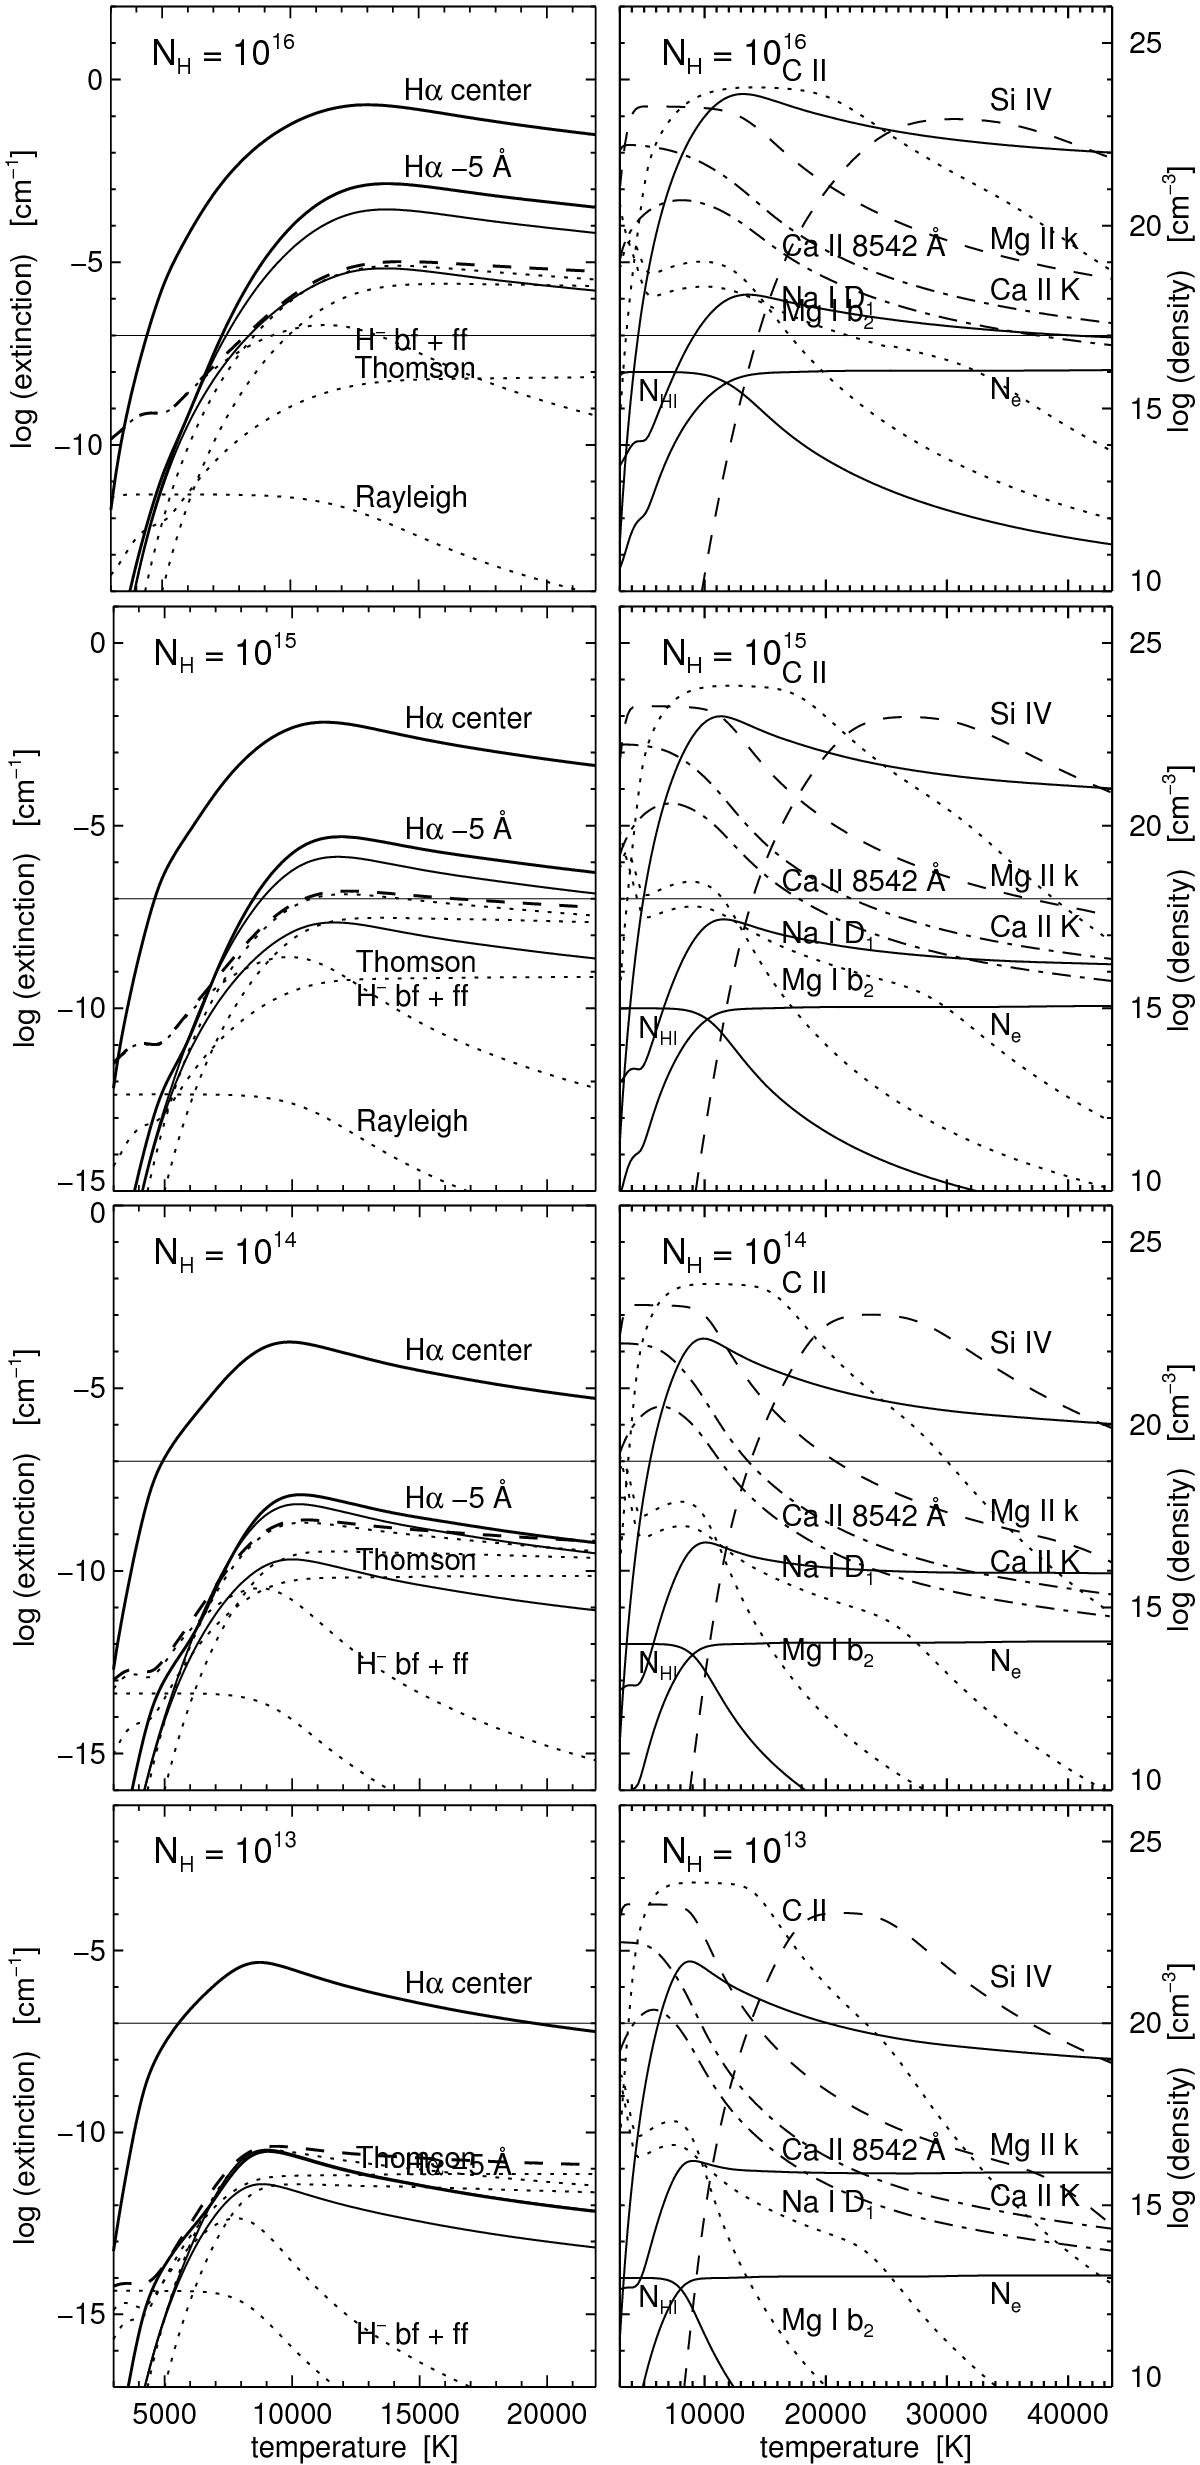
Payne-style extinction comparisons for solar gas assuming LTE. Top to bottom: total hydrogen density NH = 1016,1015, 1014, 1013 cm-3, corresponding to heights 350, 615, 850 and 1150 km in ALC7 (Fig. 1). The logarithmic extinction scales along the y-axes shift upward between panels to compensate for the density decrease. The horizontal line at y = −7 marks optical thickness unity for a slab of 100 km geometrical thickness. Left: the upper two solid curves show Hα extinction at line center and in the wing at Δλ = −5 Å. The third solid curve is for Δλ = −5 Å when using a Voigt instead of a Holtsmark distribution for linear Stark broadening. The lowest solid curve results when Stark broadening is neglected. The dashed curve is the total continuous extinction at the Hα wavelength, made up by H− and H i bound-free and free-free transitions and by Thomson and Rayleigh scattering. The dotted curves show the separate continuum contributions (the top two for H i bound-free and free-free extinction are not labeled). Right: the Hα line-center extinction is shown again (uppermost solid curve) but over a doubled temperature range. It is compared with the line-center extinction of Mg ii k (dashed), Ca ii K and Ca ii 8542 Å (dot-dashed), Mg i b2 and Na i D1 (dotted), and the IRIS lines C ii 1335.71 Å (dotted) and Si iv 1393.75 Å (dashed). The second solid curve is the total continuous extinction at 1700 Å due to H−, H i and continuous scattering. The two solid curves underneath show the competing neutral hydrogen density NH i and free electron density Ne on a comparable (but non-shifting) logarithmic scale specified along the y-axes at right. Remarkable: at left the large effect of Stark broadening. At right the large Hα extinction at high temperature.
Current usage metrics show cumulative count of Article Views (full-text article views including HTML views, PDF and ePub downloads, according to the available data) and Abstracts Views on Vision4Press platform.
Data correspond to usage on the plateform after 2015. The current usage metrics is available 48-96 hours after online publication and is updated daily on week days.
Initial download of the metrics may take a while.