Fig. 3
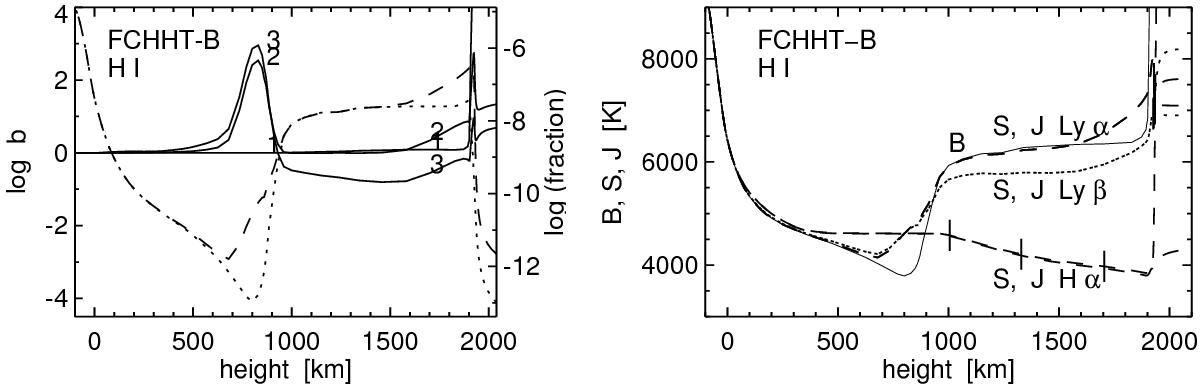
SE formation of Hα, Lyα, and Lyβ in the FCHHT-B atmosphere of Fontenla et al. (2009) in the format of Fig. 1, using RH results from Rutten & Uitenbroek (2012). Lefthand panel: NLTE departure coefficients b for hydrogen levels n = 1,2,3. The dashed and dotted NLTE and LTE fractional population curves are for n = 2. Righthand panel: corresponding line source functions.
Current usage metrics show cumulative count of Article Views (full-text article views including HTML views, PDF and ePub downloads, according to the available data) and Abstracts Views on Vision4Press platform.
Data correspond to usage on the plateform after 2015. The current usage metrics is available 48-96 hours after online publication and is updated daily on week days.
Initial download of the metrics may take a while.