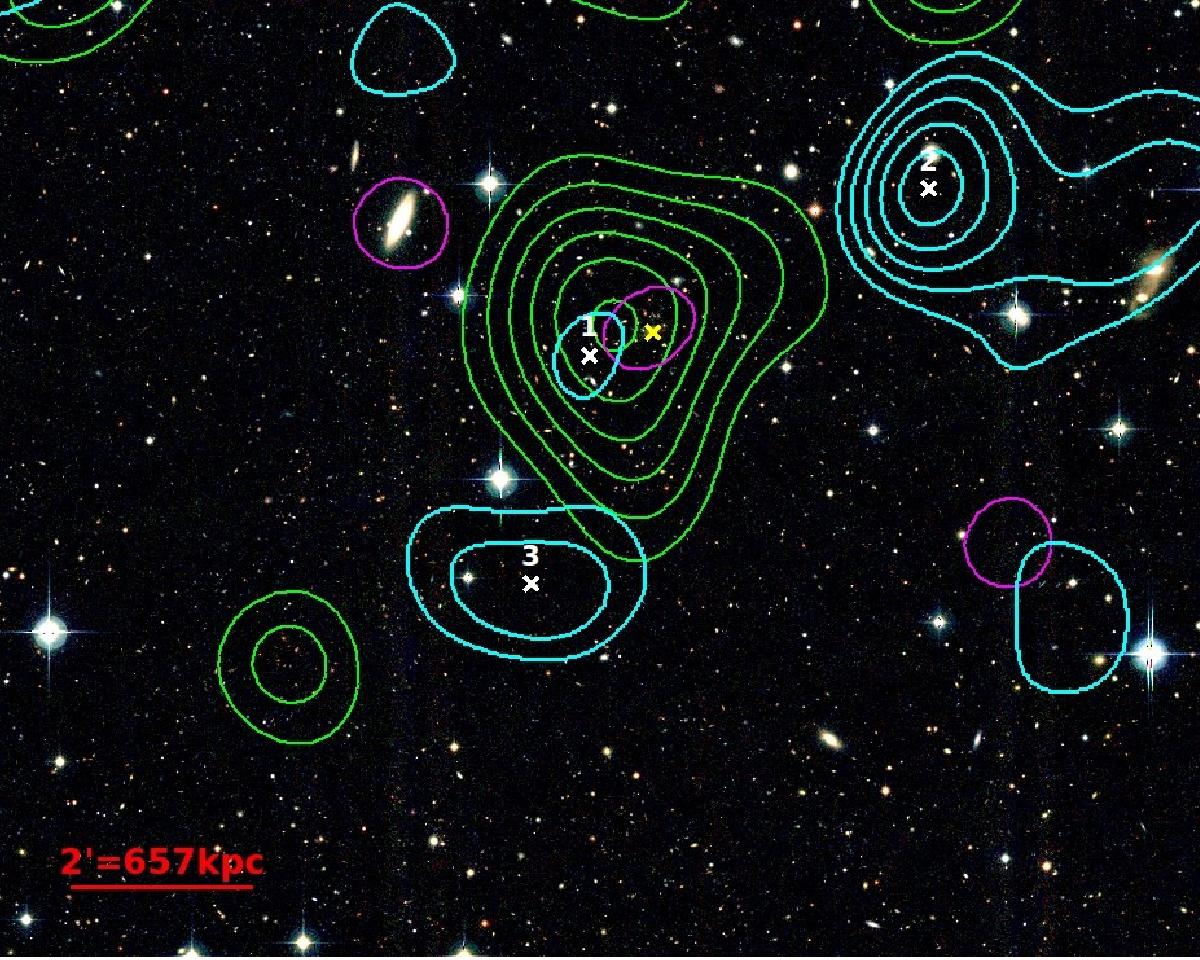
Fig. 9

Convergence density map for XDCS0329 overlaid on the three-color CFHT/MegaCam image. Contour levels (cyan) are in signal-to-noise from 3σκ with steps of 1σκ. Each weak lensing peak is noted as a white cross. The yellow cross indicates the position of the BCG. The X-ray contours starting at 2σX are in magenta and the light density contours starting at 3σ are in green. We expect 1.3 fake peaks above 3σκ and 0.2 above 4σκ in the displayed field (see Sect. 4.2 for details). The scale is given in comoving distance.
Current usage metrics show cumulative count of Article Views (full-text article views including HTML views, PDF and ePub downloads, according to the available data) and Abstracts Views on Vision4Press platform.
Data correspond to usage on the plateform after 2015. The current usage metrics is available 48-96 hours after online publication and is updated daily on week days.
Initial download of the metrics may take a while.


