Fig. 8
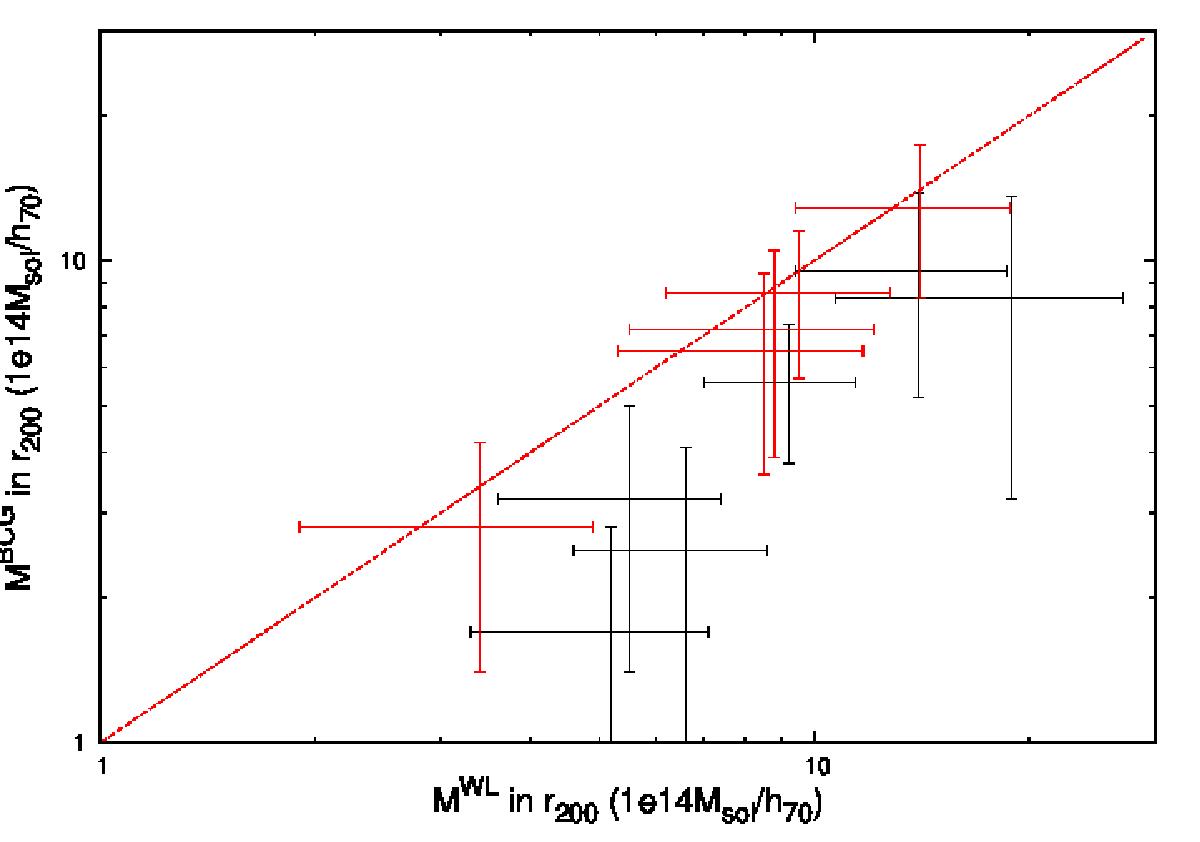
WL masses centered on the BCG versus WL masses centered on the WL peak. Red dots correspond to clusters for which the WL peak is closer than 0.52 arcmin from the BCG, and black dots for those with higher position offsets. The red dashed line is the first bisector and represents the sequence on which both masses would be equal. The different values can be found in Table 4. We note that NEP200 lies in the large offset category, even if its offset is slightly lower than 0.52 arcmin, because of its mass map reconstruction (see text for details).
Current usage metrics show cumulative count of Article Views (full-text article views including HTML views, PDF and ePub downloads, according to the available data) and Abstracts Views on Vision4Press platform.
Data correspond to usage on the plateform after 2015. The current usage metrics is available 48-96 hours after online publication and is updated daily on week days.
Initial download of the metrics may take a while.