Fig. 6
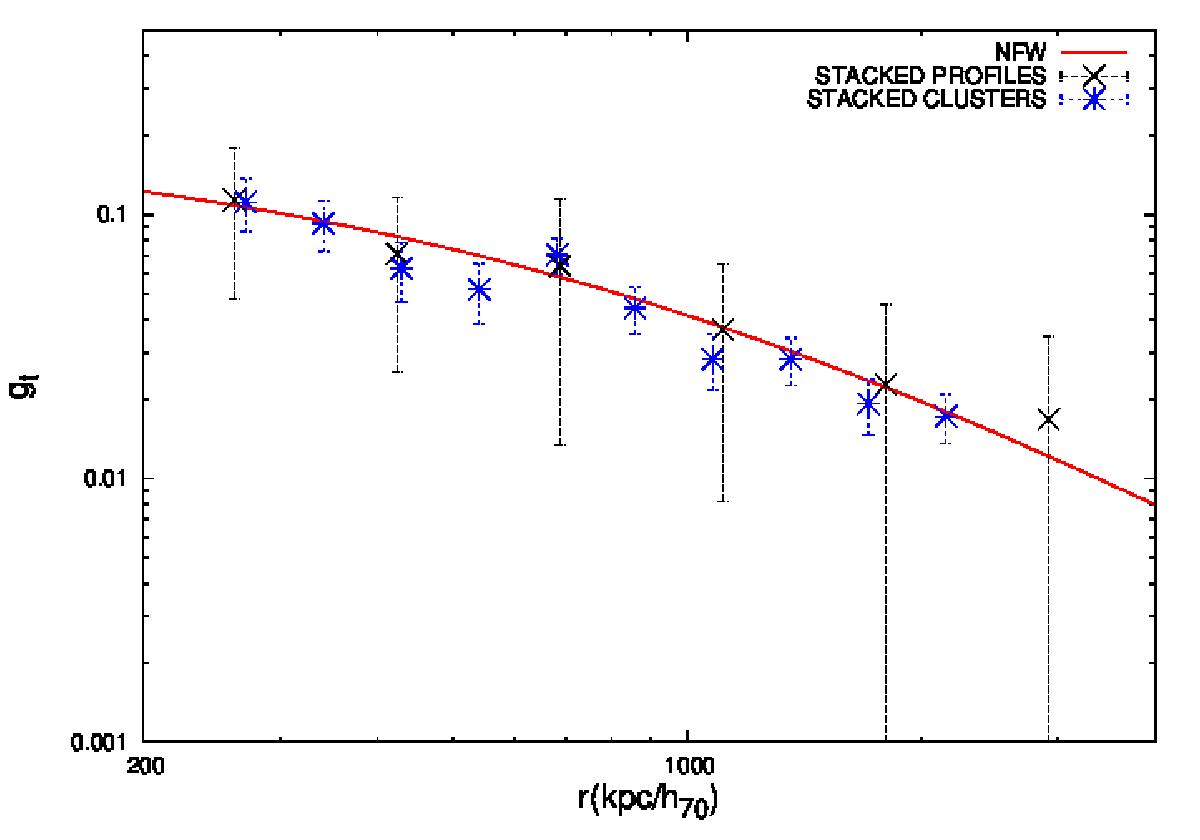
Stacked shear profile for the 12 clusters for which we were able to safely measure the mass. Black points correspond to the stacked profiles and blue points to the profile of the stacked shear catalogs (see text for details). In the first case error bars are the dispersion of values in the stack, and in the second case the rotated shear. Radius is in comoving distance and in kpc units. Individual profiles are centered on the WL peak. The red curve is the best NFW fit to the stacked profile.
Current usage metrics show cumulative count of Article Views (full-text article views including HTML views, PDF and ePub downloads, according to the available data) and Abstracts Views on Vision4Press platform.
Data correspond to usage on the plateform after 2015. The current usage metrics is available 48-96 hours after online publication and is updated daily on week days.
Initial download of the metrics may take a while.