Free Access
Fig. 5
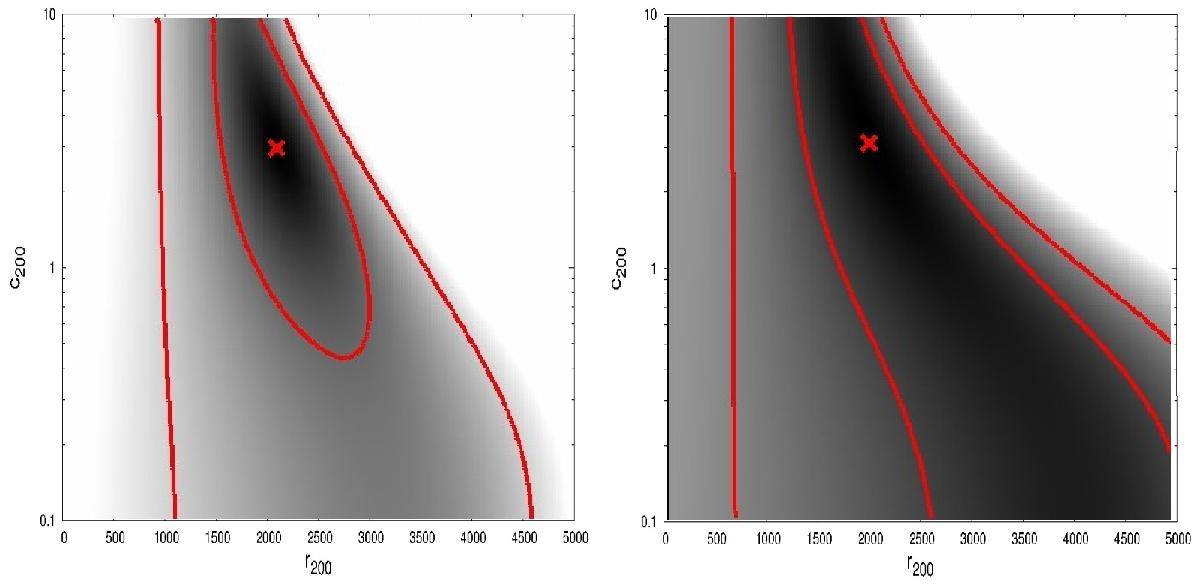
Degeneracy between the r200 and c200 NFW profile parameters for the best fit of MACSJ0717 (left, high significance) and NEP200 (right, low significance). The shaded region represents the Δχ2, with 1 and 2σ contours in red. The red cross indicates the best-fit value.
This figure is made of several images, please see below:
Current usage metrics show cumulative count of Article Views (full-text article views including HTML views, PDF and ePub downloads, according to the available data) and Abstracts Views on Vision4Press platform.
Data correspond to usage on the plateform after 2015. The current usage metrics is available 48-96 hours after online publication and is updated daily on week days.
Initial download of the metrics may take a while.