Fig. 4
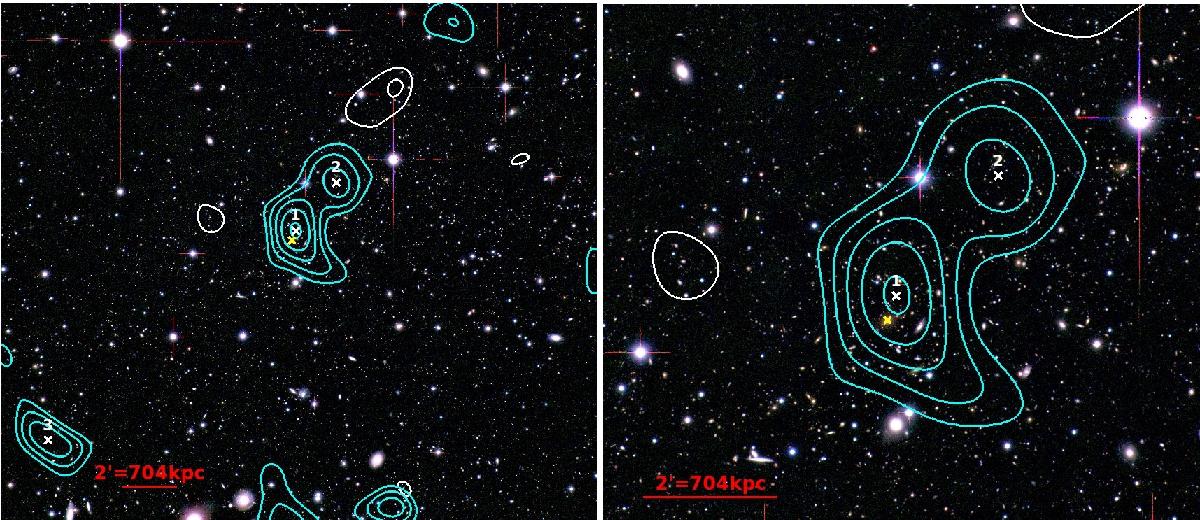
Convergence density map for MACSJ1621 overlaid on three-color image. Contour levels (cyan) are shown in signal-to-noise from 3σκ and by step of 1σκ. The white contours show the convergence density map computed from the rotated shear with the same signal-to-noise levels. We note that the signal corresponding to the cluster disappears in this reconstruction. Weak lensing peaks are indicated with a white cross starting with the highest detection. The yellow cross indicates the position of the BCG. The left panel shows the full image and the right panel shows a zoom on the cluster region.
Current usage metrics show cumulative count of Article Views (full-text article views including HTML views, PDF and ePub downloads, according to the available data) and Abstracts Views on Vision4Press platform.
Data correspond to usage on the plateform after 2015. The current usage metrics is available 48-96 hours after online publication and is updated daily on week days.
Initial download of the metrics may take a while.