Fig. B.1
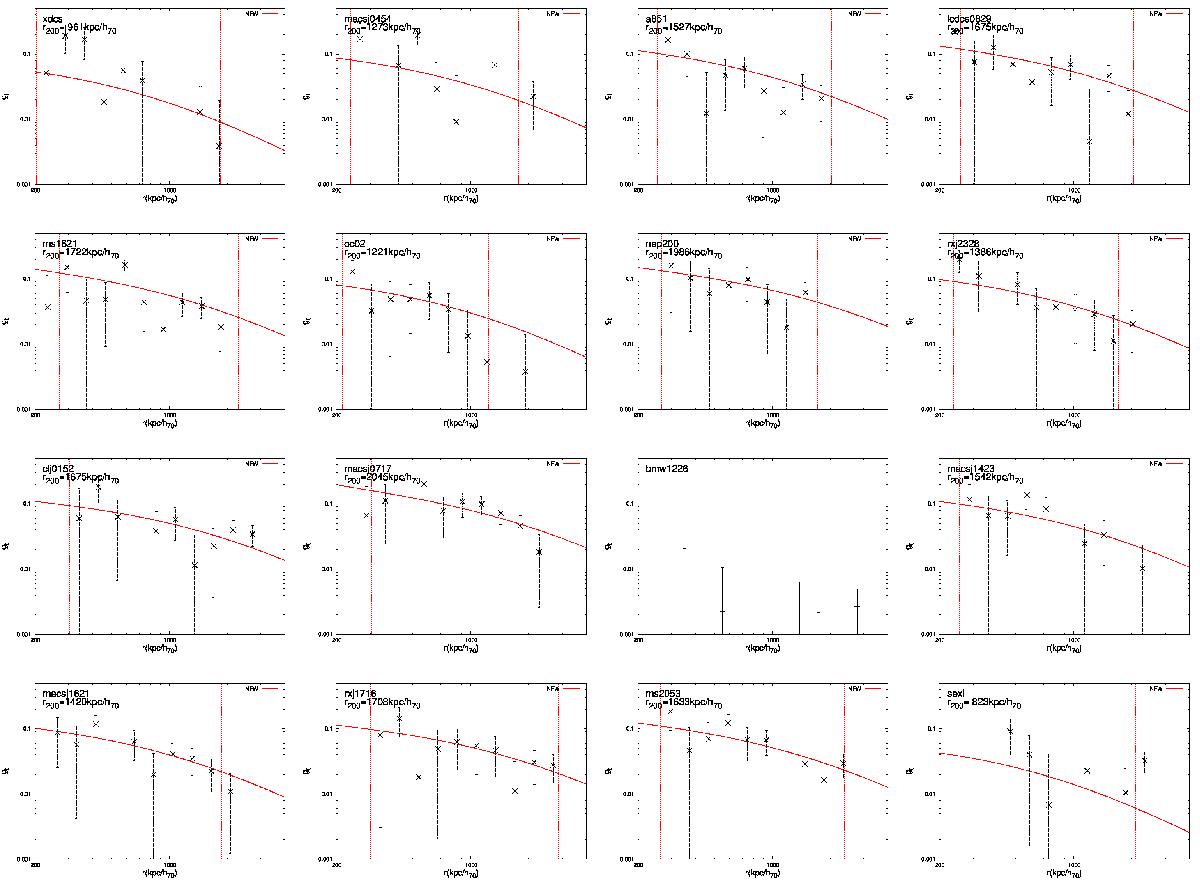
Tangential shear profile (black points) and best NFW fit (red curve) for every cluster centered on the WL peak. The error bars correspond to the rotated shear and should be equal to zero in the absence of noise. The red dotted lines represent the inner and outer radii used for the fit. See Sect. 4.3 for details. The r200 values shown can slightly differ from Table 3 because they are calculated for a single fit to the data, while we show the mean over 100 realizations of the noise in Table 3. We note that clusters with a low significance fit have most of their shear profile compatible with zero (XDCS0329, MACSJ0454, BMW1226, CXOSEXSI2056).
Current usage metrics show cumulative count of Article Views (full-text article views including HTML views, PDF and ePub downloads, according to the available data) and Abstracts Views on Vision4Press platform.
Data correspond to usage on the plateform after 2015. The current usage metrics is available 48-96 hours after online publication and is updated daily on week days.
Initial download of the metrics may take a while.