Fig. 8
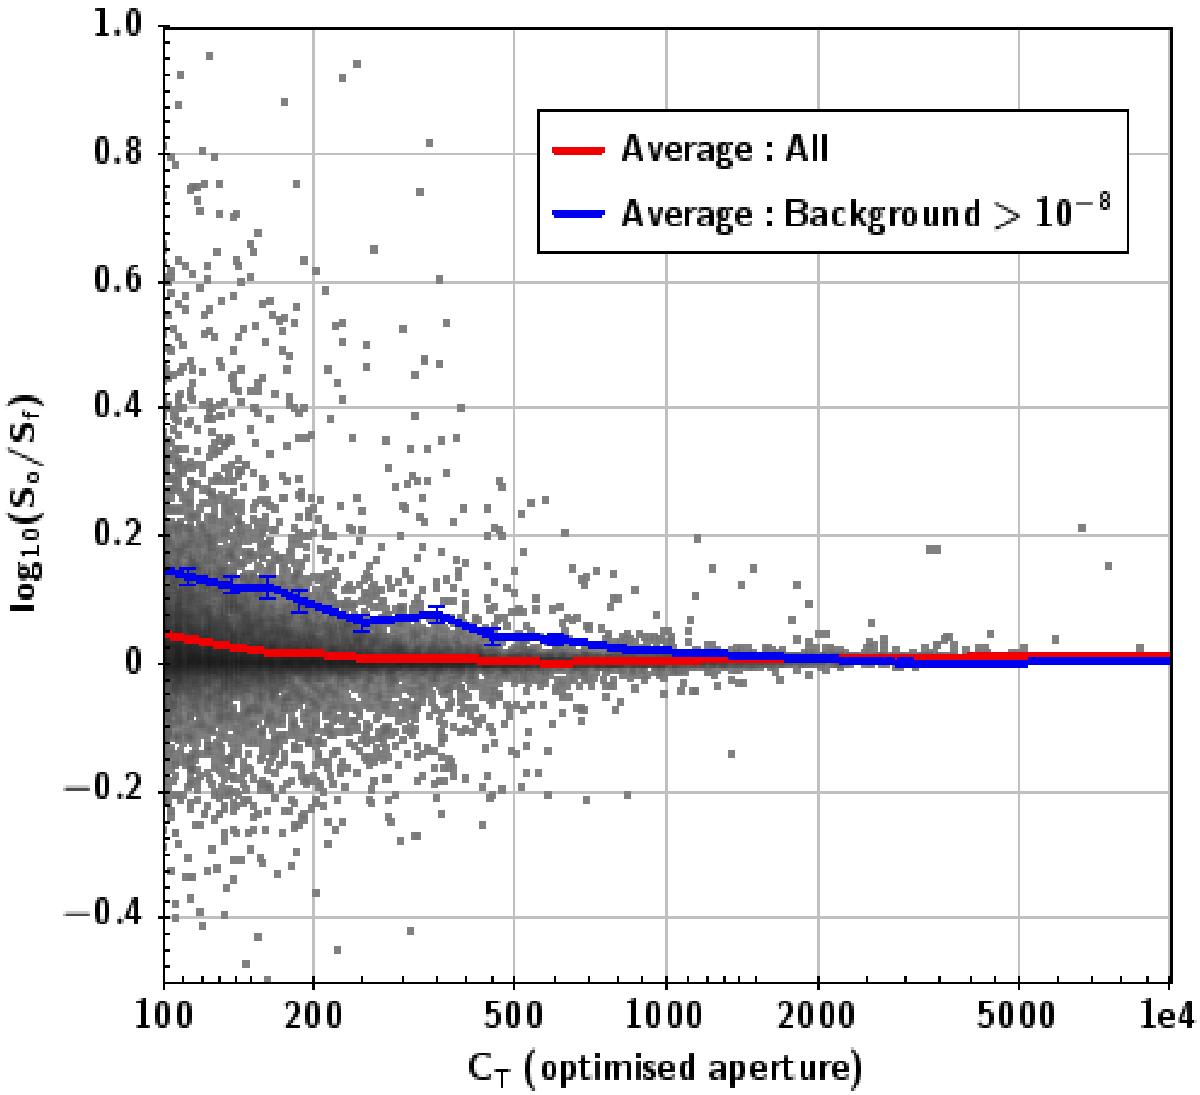
log 10(So/Sf) plotted against the log of the total counts, CT, measured from the optimised aperture. The grey points indicate the data and include only clean (SUM_FLAG = 0), point-like (EP_EXTENT = 0) detections. The red line links measurements of the average log 10(So/Sf), in bins sampling the range in CT, for cases where −1 < log 10(So/ Sf) < 1. The blue line is similar but is for the subset of data where, additionally, the background rate is >10-8 cts s-1 (sub-pixel)-2 (sub-pixels have side lengths of 0.05′′). The lower X-axis limit reflects the minimum threshold of 100 total counts in the optimised extraction aperture, imposed for extracting XMM source spectra; the plot is otherwise truncated for clarity.
Current usage metrics show cumulative count of Article Views (full-text article views including HTML views, PDF and ePub downloads, according to the available data) and Abstracts Views on Vision4Press platform.
Data correspond to usage on the plateform after 2015. The current usage metrics is available 48-96 hours after online publication and is updated daily on week days.
Initial download of the metrics may take a while.