Fig. 7
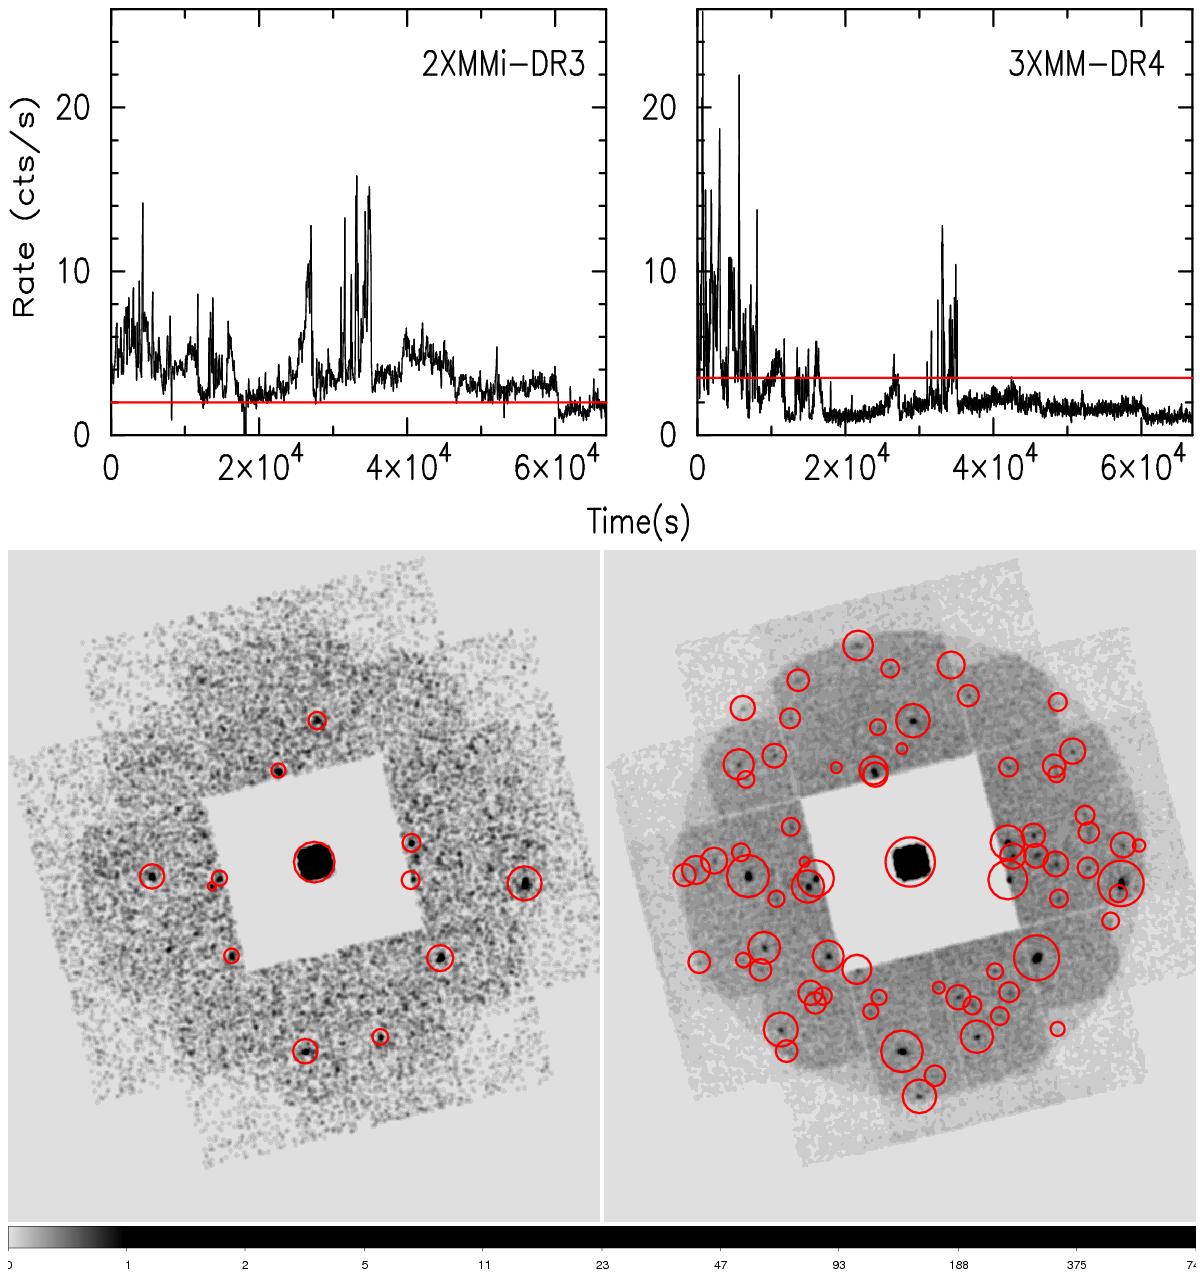
An example of the improvement offered by the optimised background flare filtering algorithm. Top panels: Left: high-energy MOS1 background flare light curve created by the pre-cat9.0 pipeline, used for the 2XMMi-DR3 catalogue – the red line is the fixed (2 cts/s/arcmin2) count rate cut threshold applied. Right: in-band (0.5–7.5 keV) light curve used in the cat-9.0 pipeline used for 3XMM-DR4 and 3XMM-DR5 – the red line shows the optimised cut rate threshold derived for the light curve. The lower panels show the resulting, corresponding (smoothed) images, after filtering out the data above the respective rate-cut thresholds. Sources found by the source detection algorithm are indicated by red circles.
Current usage metrics show cumulative count of Article Views (full-text article views including HTML views, PDF and ePub downloads, according to the available data) and Abstracts Views on Vision4Press platform.
Data correspond to usage on the plateform after 2015. The current usage metrics is available 48-96 hours after online publication and is updated daily on week days.
Initial download of the metrics may take a while.