Fig. 6
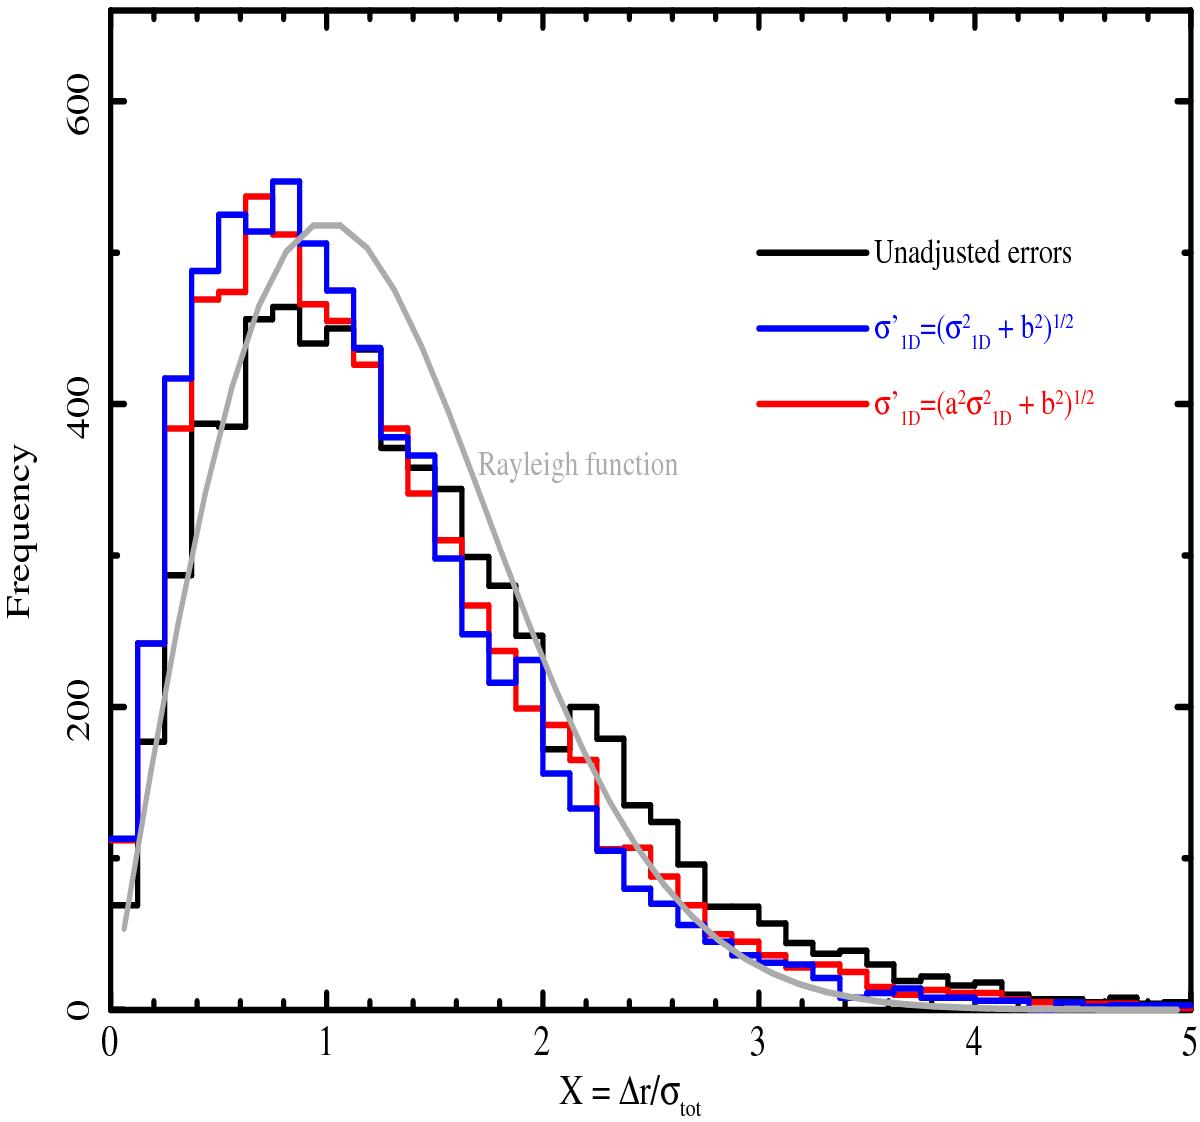
Similar to Fig. 5 but comparing results that involve the simplest adjustments to the XMM position errors. For reference, the black histogram is based on using the unadjusted XMM position errors while the expected Rayleigh distribution is overlaid (grey). The blue histogram represents the simplest adjustment to the XMM position errors, involving the addition of a systematic in quadrature, b(=0.37), while the red histogram involves both a scaling of the XMM position error by a factor a(=1.12) and addition of a systematic, b(=0.27), in quadrature. These histograms are based on slightly different filtering compared to Fig. 5, as explained in the text
Current usage metrics show cumulative count of Article Views (full-text article views including HTML views, PDF and ePub downloads, according to the available data) and Abstracts Views on Vision4Press platform.
Data correspond to usage on the plateform after 2015. The current usage metrics is available 48-96 hours after online publication and is updated daily on week days.
Initial download of the metrics may take a while.