Fig. 5
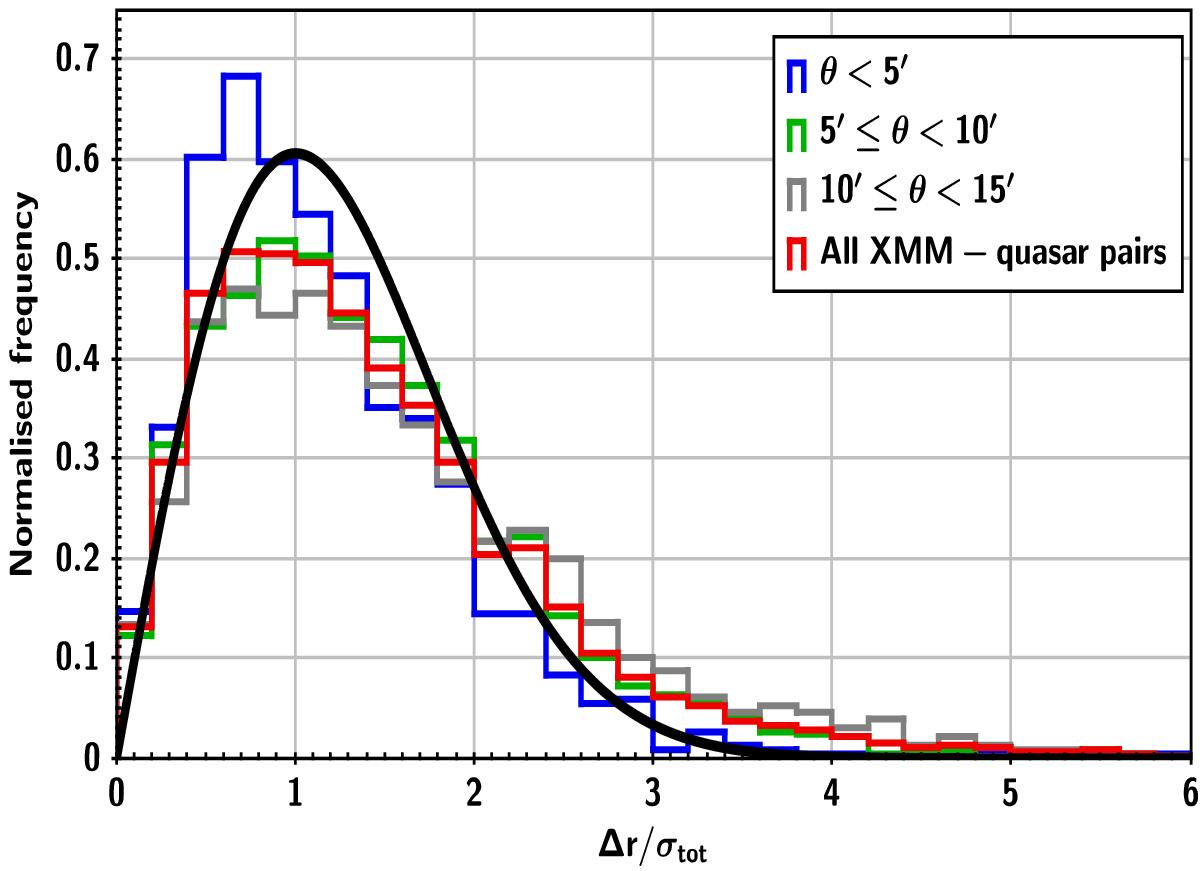
Distribution of position-error-normalised offsets between 3XMM-DR5 X-ray sources and SDSS quasar counterparts (red histogram). The expected Rayleigh distribution is overlaid (black). The XMM position errors are as provided in the 3XMM catalogues (i.e. unadjusted, with no scaling or systematic included). Also shown are similar histograms for data from EPIC off-axis angles, θ, in the ranges θ< 5′ (blue), 5′ ≤ θ< 10′ (green) and 10′ ≤ θ< 15′ (grey). The data are normalised to unit area.
Current usage metrics show cumulative count of Article Views (full-text article views including HTML views, PDF and ePub downloads, according to the available data) and Abstracts Views on Vision4Press platform.
Data correspond to usage on the plateform after 2015. The current usage metrics is available 48-96 hours after online publication and is updated daily on week days.
Initial download of the metrics may take a while.