Free Access
Fig. 10
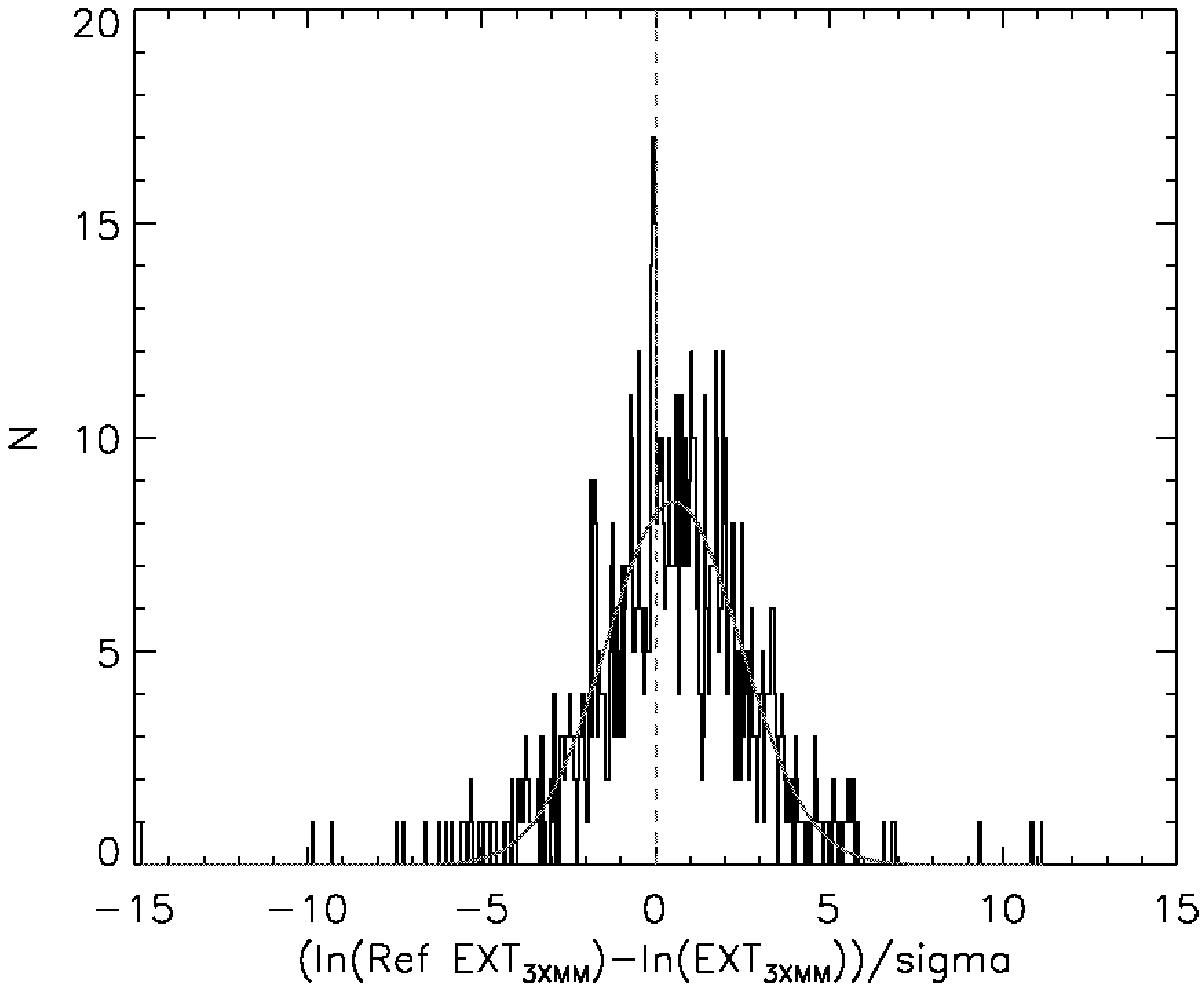
Histogram of the logarithm of the ratio of extensions between the best observation and the other observations of the same source, normalised by the error. The solid red line is the best Gaussian fit to the histogram. The dashed red line is the expected mean (0).
Current usage metrics show cumulative count of Article Views (full-text article views including HTML views, PDF and ePub downloads, according to the available data) and Abstracts Views on Vision4Press platform.
Data correspond to usage on the plateform after 2015. The current usage metrics is available 48-96 hours after online publication and is updated daily on week days.
Initial download of the metrics may take a while.