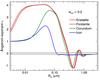
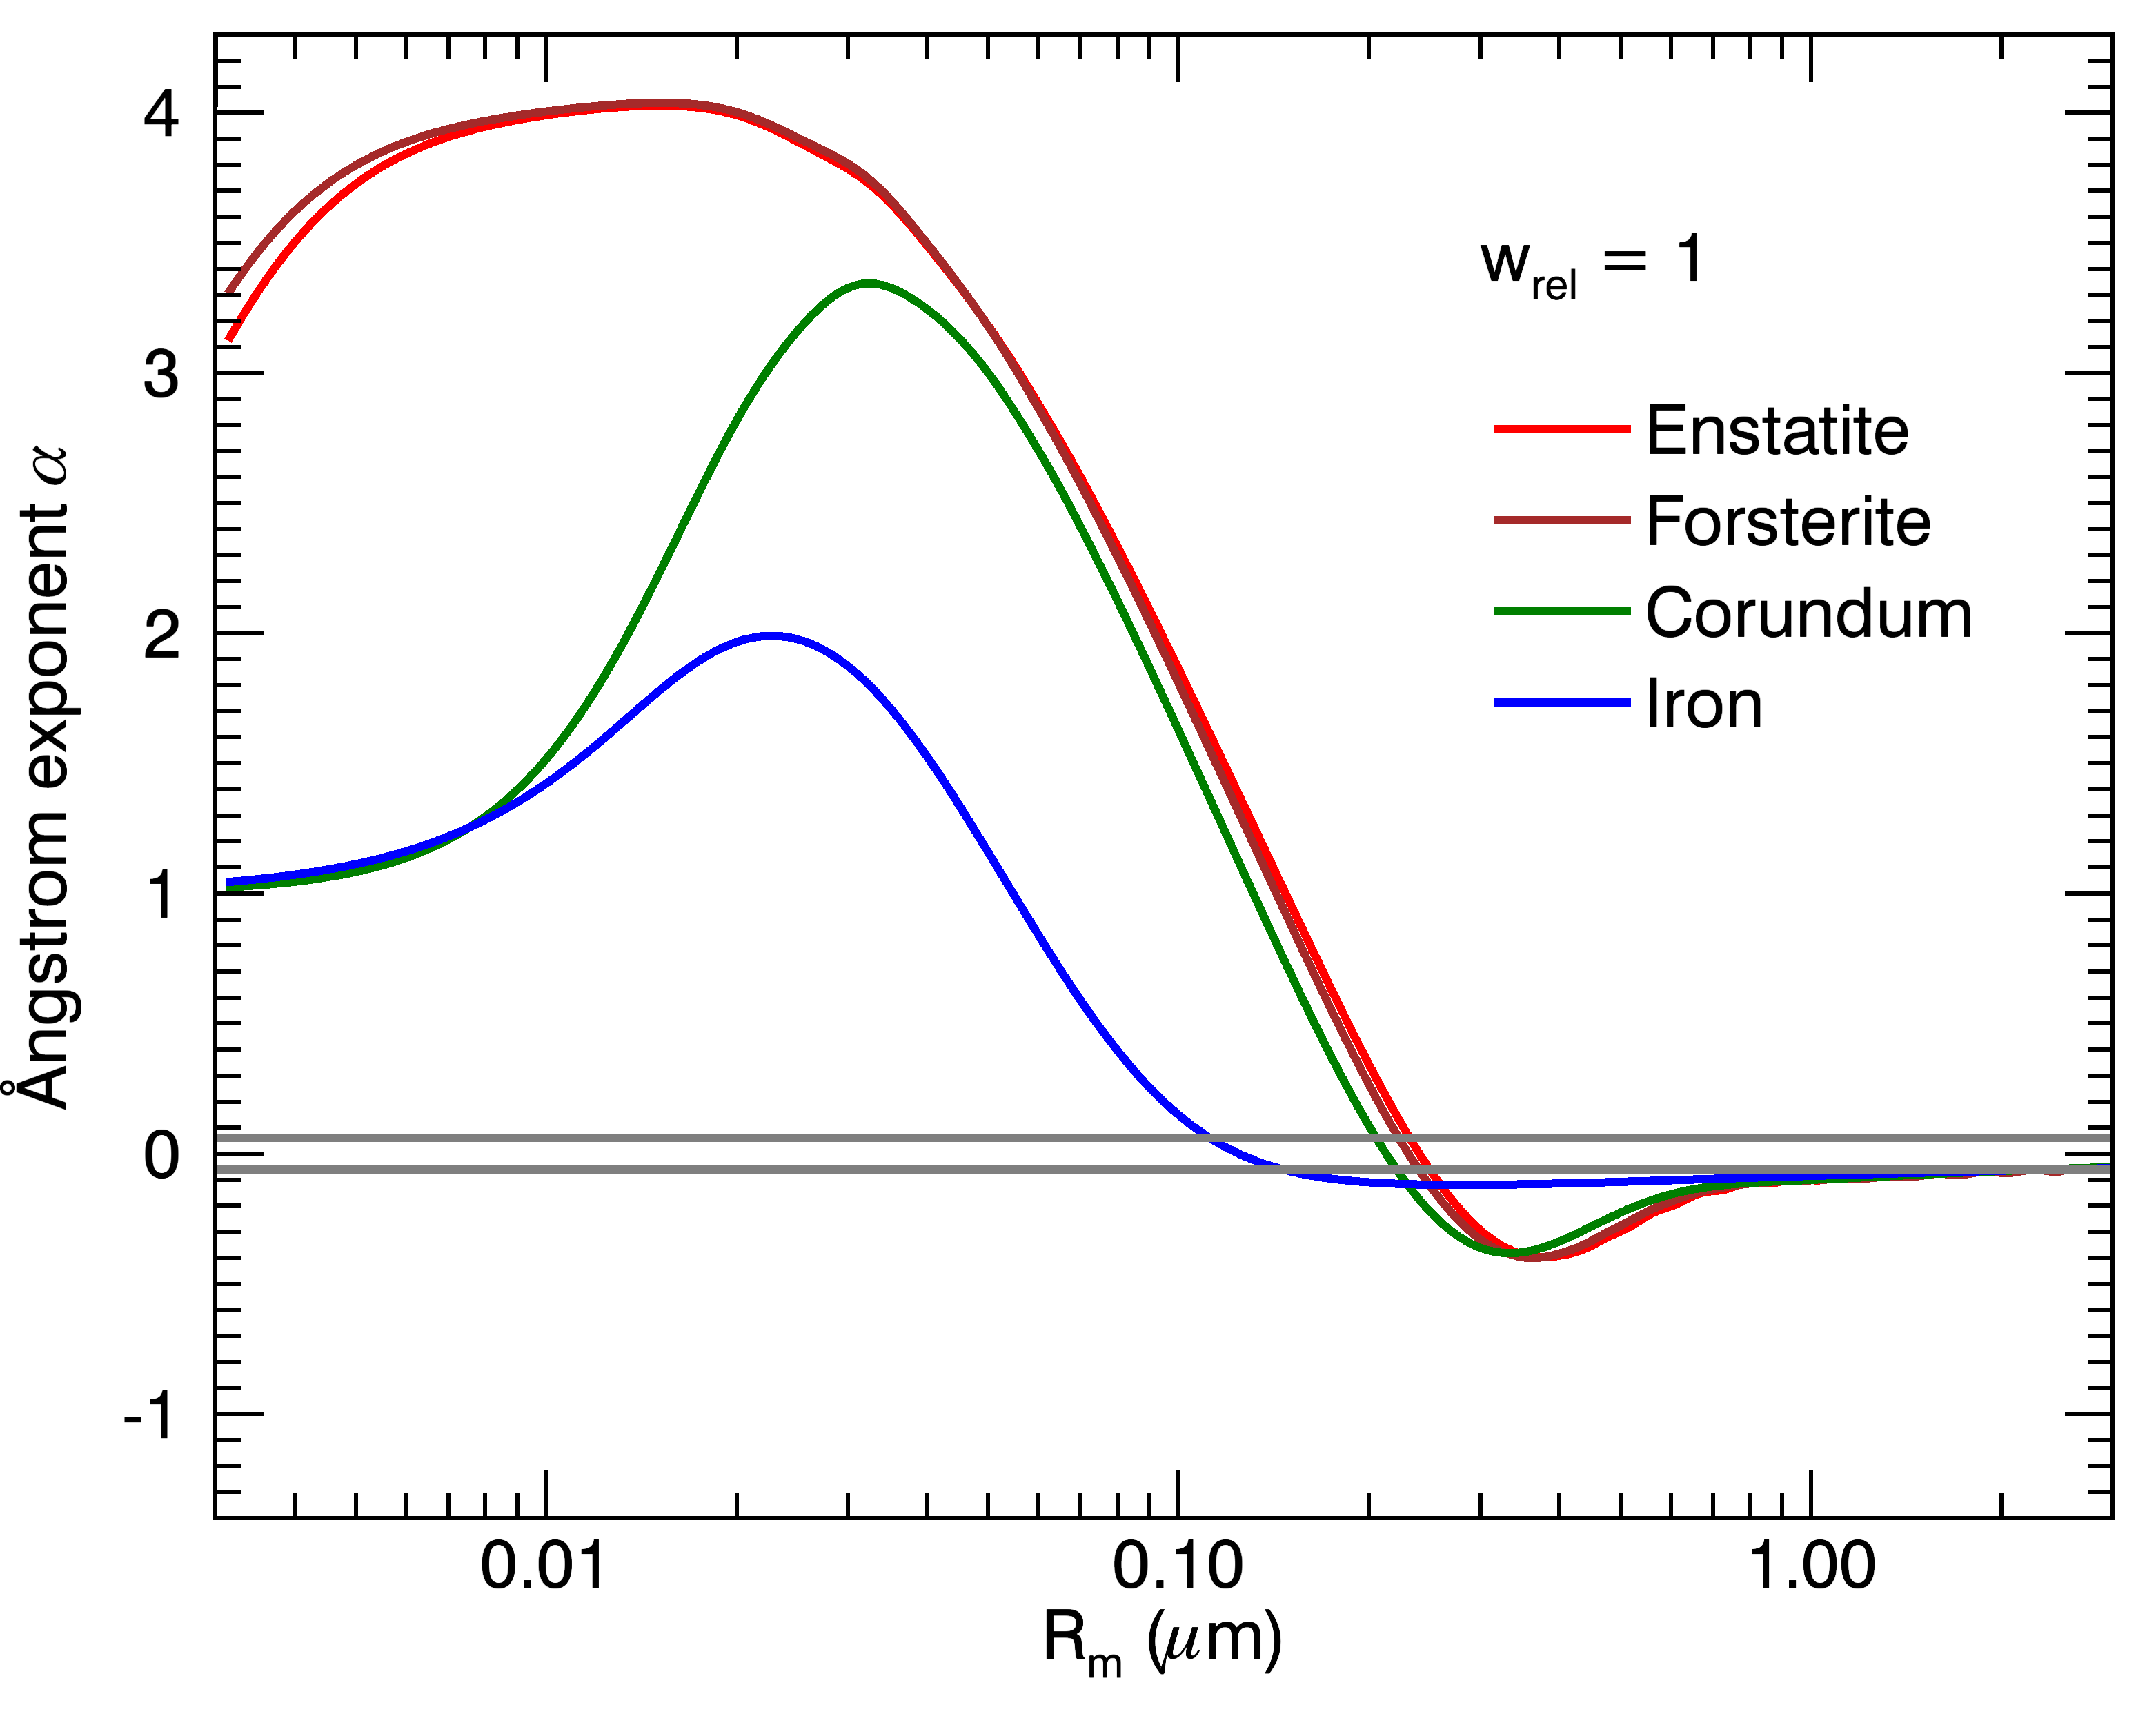
Fig. 3

Calculated Ångström exponents α as a function of particle size for four different minerals. For each mineral we used a lognormal particle size distribution (top panel) and a narrower size distribution of 1/5th that width (bottom panel), where Rm is the median particle size in the distribution. The two gray horizontal lines denote the 2σ lower and upper limits to α obtained from the GTC observations.

Current usage metrics show cumulative count of Article Views (full-text article views including HTML views, PDF and ePub downloads, according to the available data) and Abstracts Views on Vision4Press platform.
Data correspond to usage on the plateform after 2015. The current usage metrics is available 48-96 hours after online publication and is updated daily on week days.
Initial download of the metrics may take a while.