Free Access
Fig. A.2
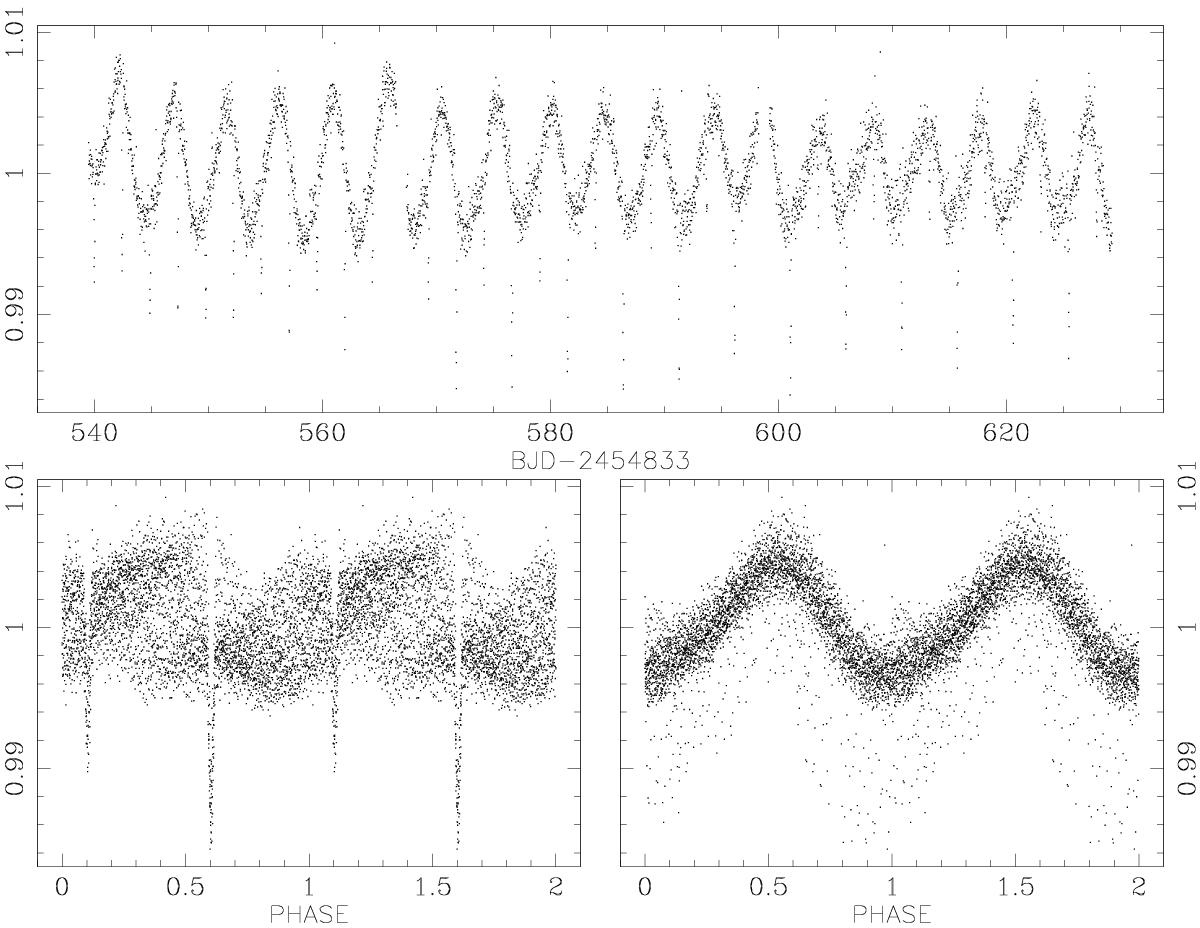
S3 light curves. Top panel: the normalized light curve extracted from quarter 6. Bottom panels: the same light curve phased on the period 2.443098 d, clearly showing that the true eclipse period is twice this value (left) and the best-fit period for the sine-like oscillations, P = 4.742325 d (right).
Current usage metrics show cumulative count of Article Views (full-text article views including HTML views, PDF and ePub downloads, according to the available data) and Abstracts Views on Vision4Press platform.
Data correspond to usage on the plateform after 2015. The current usage metrics is available 48-96 hours after online publication and is updated daily on week days.
Initial download of the metrics may take a while.