Free Access
Fig. 5
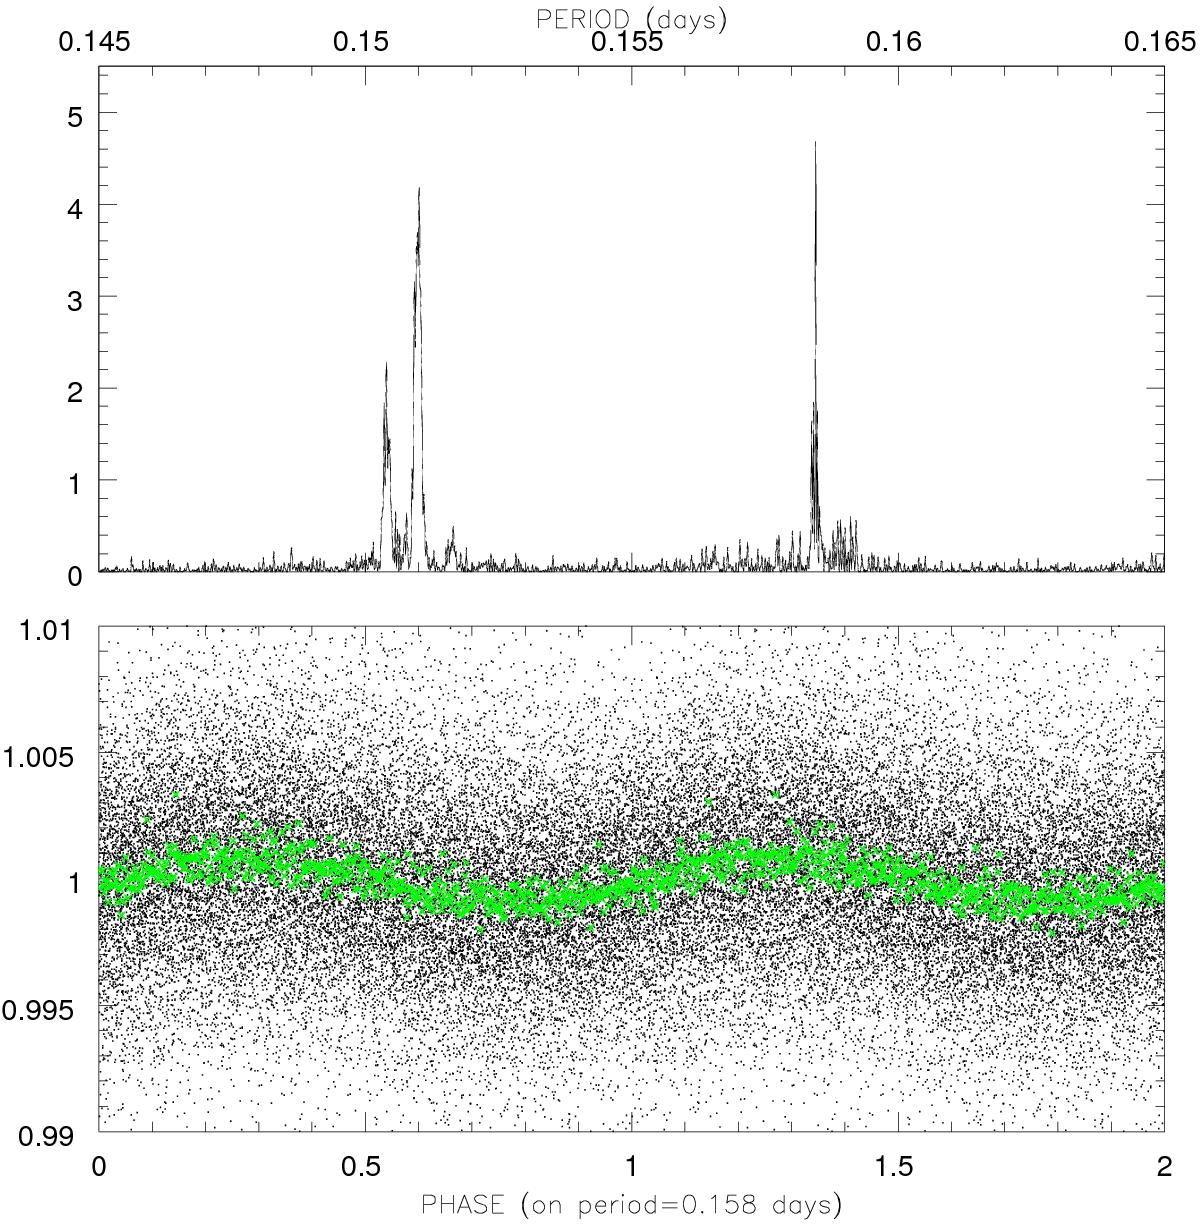
Top panel: periodogram of the 20 quiescent intervals of Fig. 3, searched together. Bottom panel: light curve data points from the 20 intervals phased on the period 0.15845058 d (~3.8 h, black points). The green crosses represent a phase binned version of the same light curve (bin size 50 data points).
Current usage metrics show cumulative count of Article Views (full-text article views including HTML views, PDF and ePub downloads, according to the available data) and Abstracts Views on Vision4Press platform.
Data correspond to usage on the plateform after 2015. The current usage metrics is available 48-96 hours after online publication and is updated daily on week days.
Initial download of the metrics may take a while.