Fig. 3
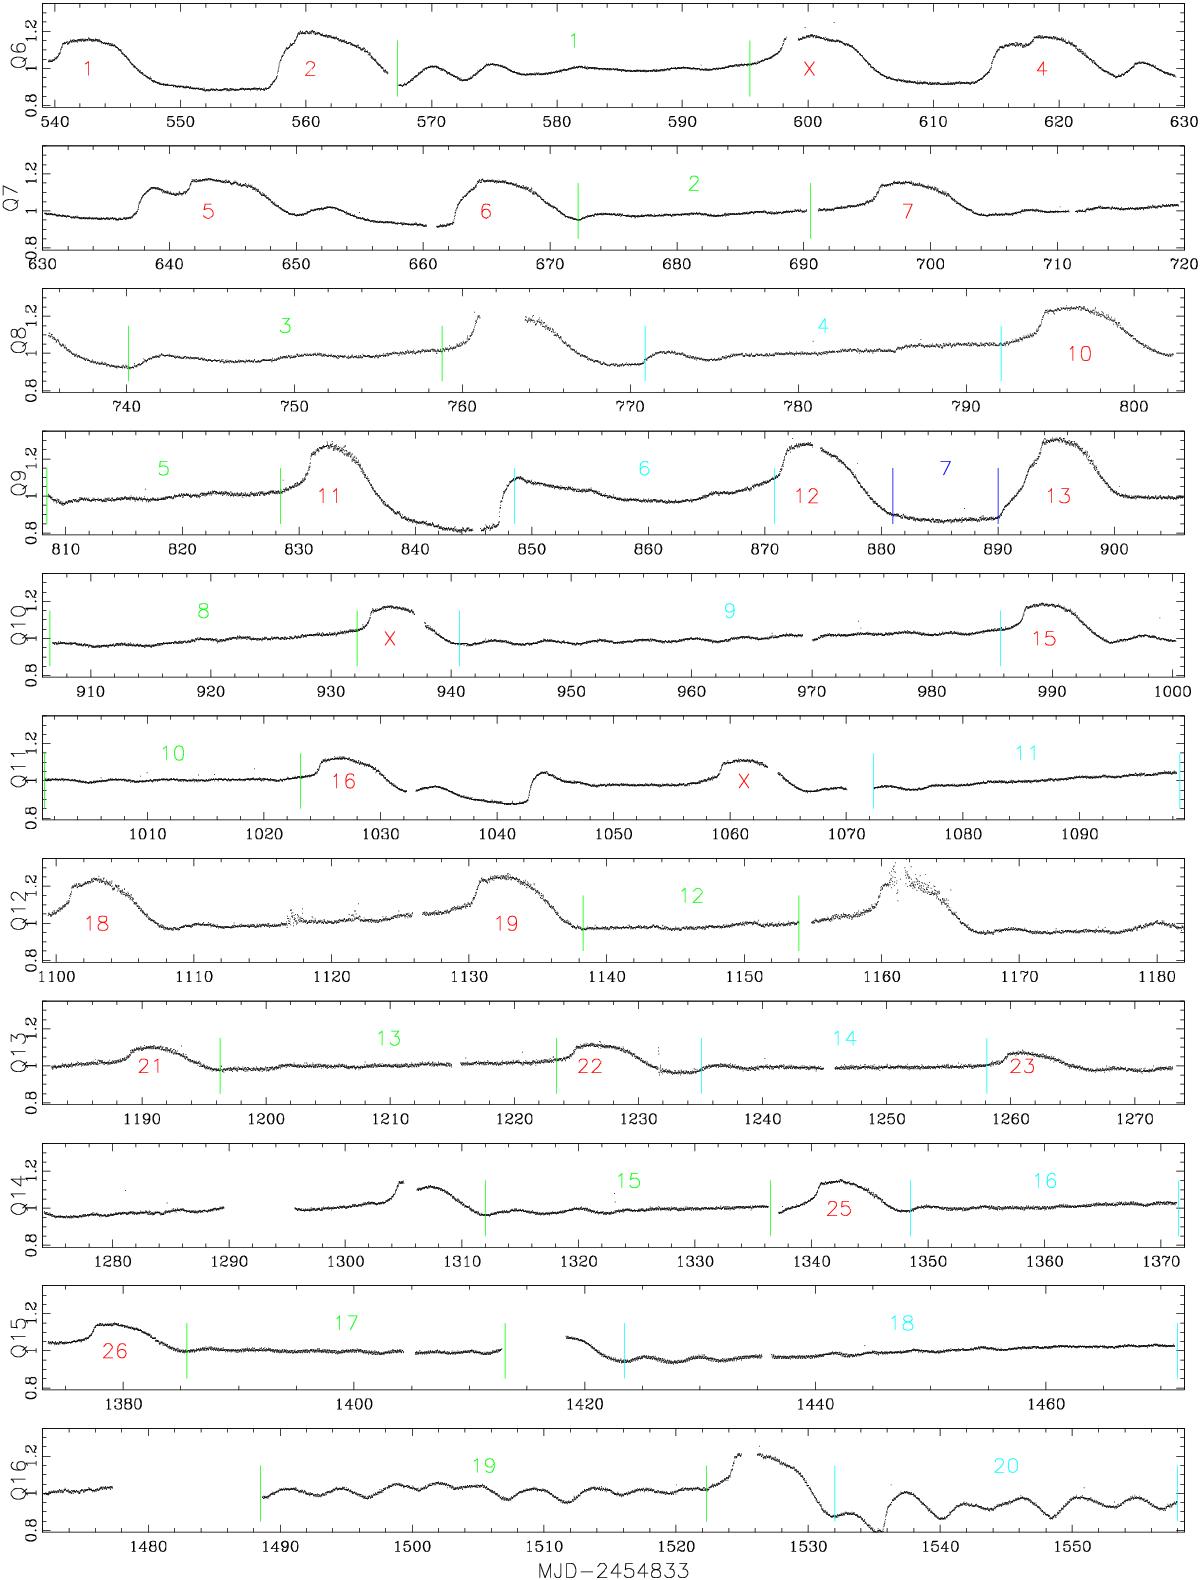
Kepler V523 Lyr light curve shown for each quarter. Pairs of vertical colored lines delimits quiescent intervals considered in the time series analysis for period searching. The intervals are also identified by a sequential number of matching color. Red numbers indicate the outbursts considered for their characterization. The three outbursts marked with an X were considered only for the estimate of the recurrence time using their peak value. See text for more details.
Current usage metrics show cumulative count of Article Views (full-text article views including HTML views, PDF and ePub downloads, according to the available data) and Abstracts Views on Vision4Press platform.
Data correspond to usage on the plateform after 2015. The current usage metrics is available 48-96 hours after online publication and is updated daily on week days.
Initial download of the metrics may take a while.