Fig. 1
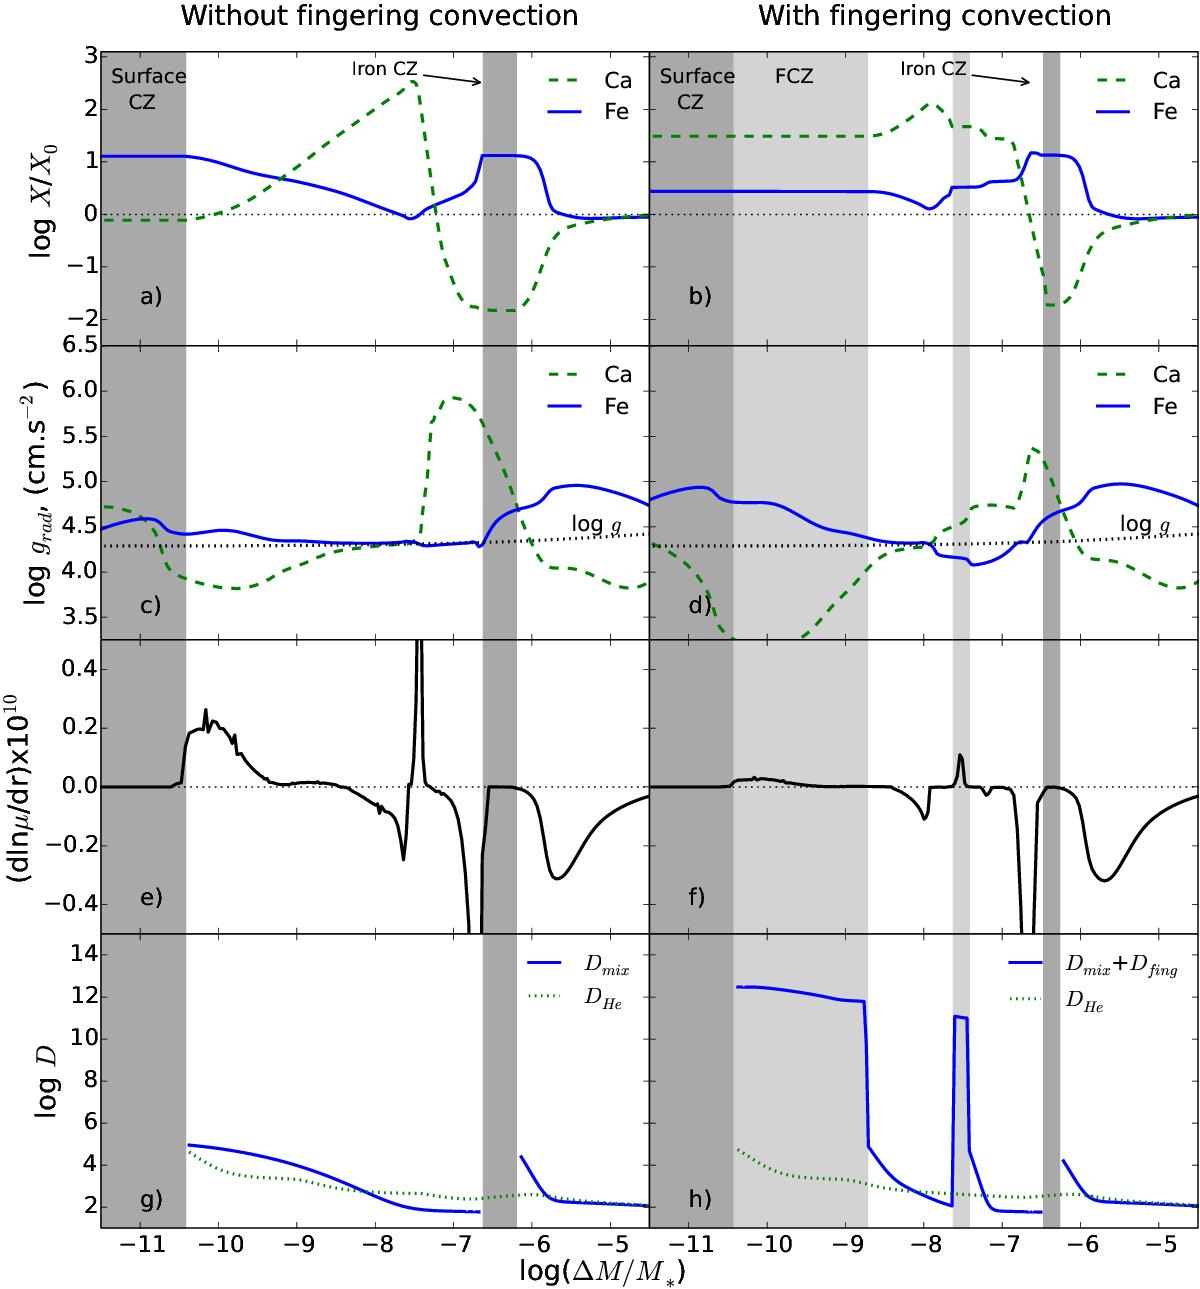
Profiles of important physical quantities as a function of log (ΔM/M∗) in two 1.7 M⊙ models at 100 Myr with (right panel) and without (left panels) computation of fingering convection. Dynamical (CZ) and fingering (FCZ) convective zones are represented by dark and light grey regions, respectively. Panels a) and b) show calcium (green dashed lines) and iron (blue solid lines) abundances compare to their initial value. Panels c) and d) show calcium (green dashed lines) and iron (blue solid lines) radiative accelerations. The black dotted line represents the gravity. Panels e) and f) show the lnμ-gradient with radius (black solid lines), panels g) and h) show the helium diffusion coefficient (green dotted lines) and effective mixing coefficient (blue solid lines).
Current usage metrics show cumulative count of Article Views (full-text article views including HTML views, PDF and ePub downloads, according to the available data) and Abstracts Views on Vision4Press platform.
Data correspond to usage on the plateform after 2015. The current usage metrics is available 48-96 hours after online publication and is updated daily on week days.
Initial download of the metrics may take a while.