Fig. 8
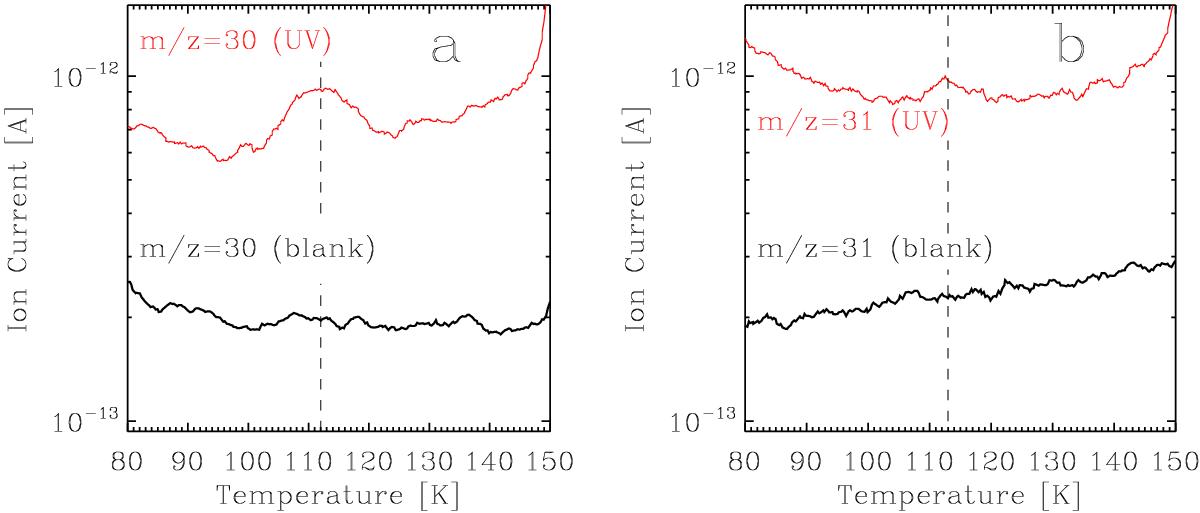
a) TPD curve of the m/z = 30 mass fragment, corresponding to the molecular ion of H2CO, after irradiation in experiment 3 (red) compared to the blank (black). A desorption peak at ~112 K (dashed line) confirms the formation of formaldehyde. b) TPD curve of the m/z = 31 mass fragment, corresponding to the molecular ion of H![]() CO, after irradiation in experiment 7 (red) compared to the blank (black). A desorption peak at ~113 K (dashed line) confirms the formation of formaldehyde.
CO, after irradiation in experiment 7 (red) compared to the blank (black). A desorption peak at ~113 K (dashed line) confirms the formation of formaldehyde.
Current usage metrics show cumulative count of Article Views (full-text article views including HTML views, PDF and ePub downloads, according to the available data) and Abstracts Views on Vision4Press platform.
Data correspond to usage on the plateform after 2015. The current usage metrics is available 48-96 hours after online publication and is updated daily on week days.
Initial download of the metrics may take a while.