Fig. 7
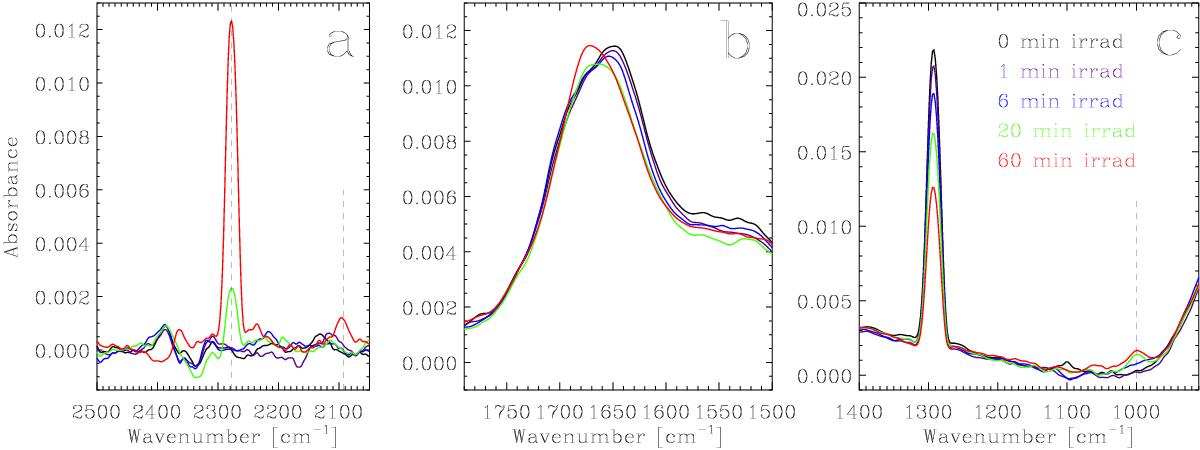
Evolution of the IR spectrum of the H2O:CH4 ice mixture during UV photoprocessing in experiment 9, see Table 6. Results were similar in experiments 7, 8, and 10. a) Formation of 13CO2 and 13CO leads to the appearence of two C-O stretching bands at 2277 cm-1 and 2092 cm-1, respectively (dashed lines). b) Evolution of the O-H deformation band of H2O. c) Evolution of the C-H deformation band of CH4 at 1292 cm-1. The new feature at 1000 cm-1 is due to the formation of methanol.
Current usage metrics show cumulative count of Article Views (full-text article views including HTML views, PDF and ePub downloads, according to the available data) and Abstracts Views on Vision4Press platform.
Data correspond to usage on the plateform after 2015. The current usage metrics is available 48-96 hours after online publication and is updated daily on week days.
Initial download of the metrics may take a while.