Fig. 6
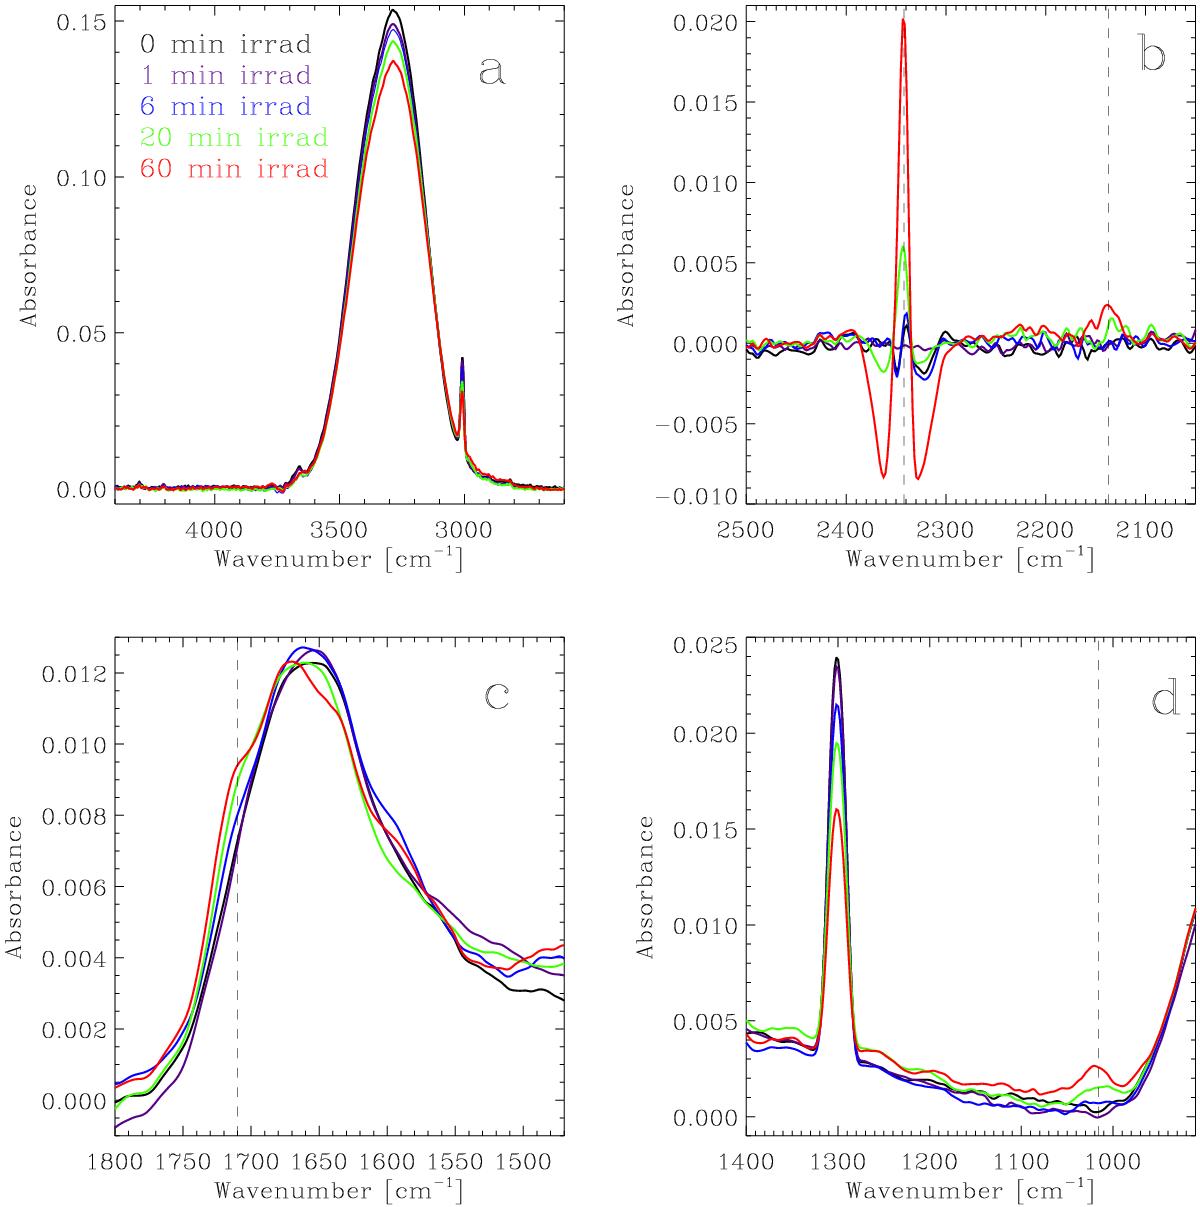
Evolution of the IR spectrum of the H2O:CH4 ice mixture during UV photoprocessing in experiment 6, see Table 6. Results were similar in experiments 3−5. a) Evolution of the O-H stretching band of H2O (broad band peaking at ~3280 cm-1), and the C-H stretching band of CH4 (in the red side of the former). b) Formation of CO2 and CO leads to the appearence of two C-O stretching bands at 2342 cm-1 and 2137 cm-1, respectively (dashed lines). Negative absorbances are due to the atmospheric correction applied by the FTIR software, but the band is due to solid CO2, as the peak position indicates. c) Evolution of the O-H deformation band of H2O. The apearance of a shoulder at ~1710 cm-1 is probably due to the formation of H2CO. d) Evolution of the C-H deformation band of CH4 at 1300 cm-1. The new feature at 1016 cm-1 is due to the formation of methanol.
Current usage metrics show cumulative count of Article Views (full-text article views including HTML views, PDF and ePub downloads, according to the available data) and Abstracts Views on Vision4Press platform.
Data correspond to usage on the plateform after 2015. The current usage metrics is available 48-96 hours after online publication and is updated daily on week days.
Initial download of the metrics may take a while.