Fig. 4
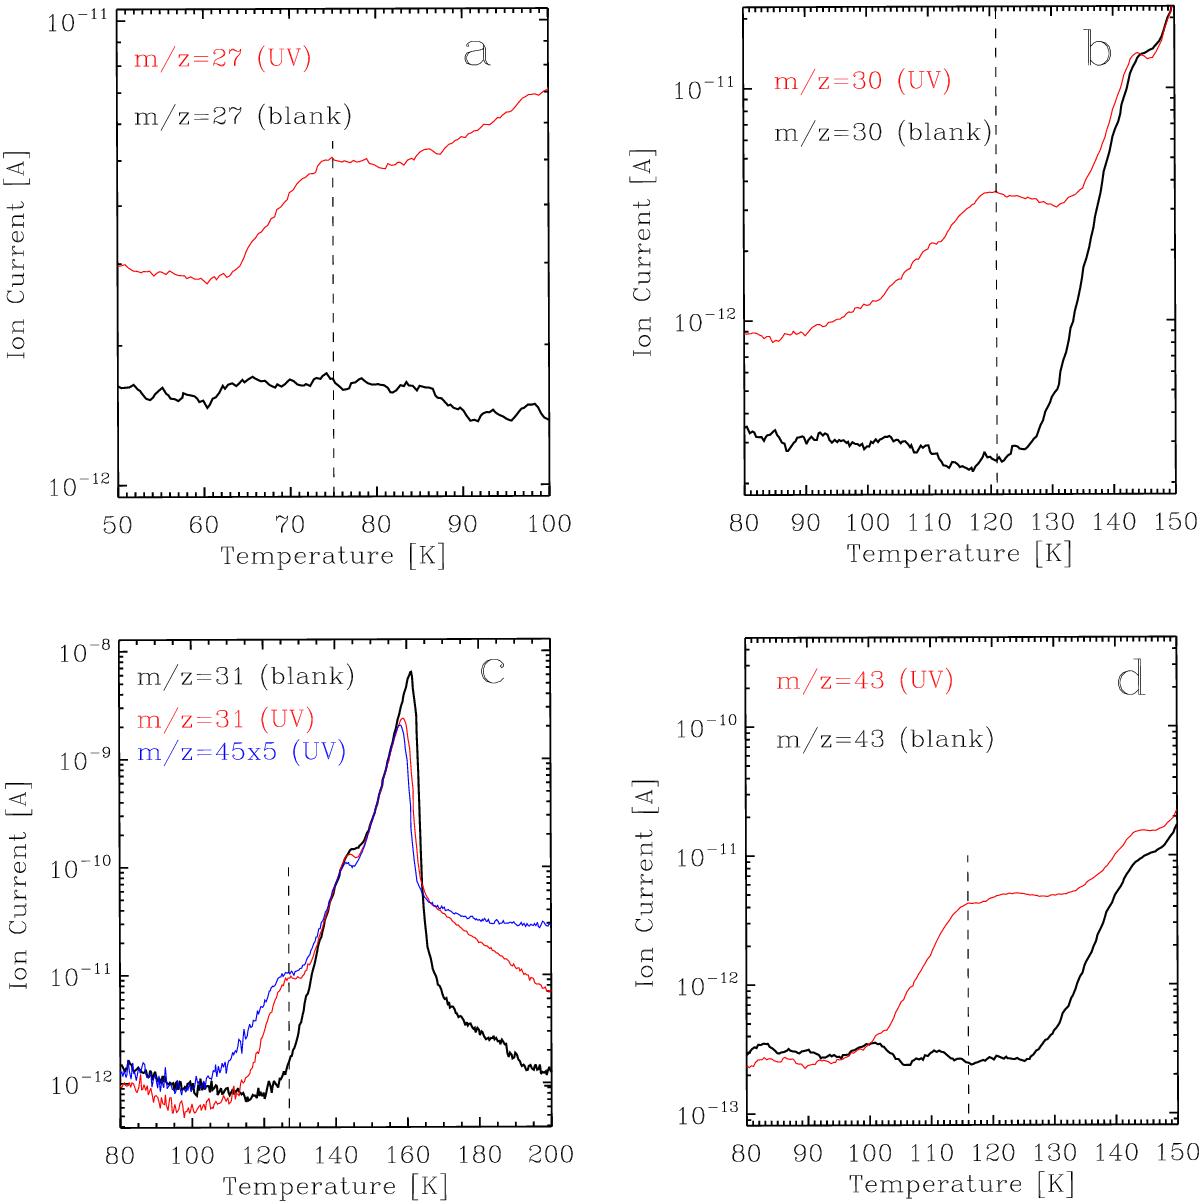
TPD curves displaying the thermal desorption of photoproducts through selected mass fragments at the end of experiment 2 (see Table 3) in red, compared to the blank experiment with no irradiation (black). a) TPD curves of the m/z = 27 mass fragment, corresponding to the C2H![]() fragment of C2H6. A desorption peak at ~75 K (dashed line) confirms the presence of ethane in the processed ethanol ice (desorption of a pure ethane ice takes place above 60 K according to Öberg et al. 2009). b) TPD curves of the m/z = 30 mass fragment, corresponding to the molecular ion of H2CO. The desorption peaking at ~121 K (dashed line) confirms the formation of formaldehyde during UV photoprocessing of a pure ethanol ice (see text). c) TPD curves of the m/z = 31 mass fragment corresponding to the CH3O+ fragment of CH3OH. Since no excess in the desorption is detected at ~145 K compared to the blank, formation of methanol during UV photoprocessing of a pure ethanol ice is negligible. Desorption at ~127 K (dashed line) is probably due to an earlier ethanol desorption triggered by less polar and more volatile components in the ice matrix that were not present in the blank experiment (mainly formaldehyde and acetaldehyde), since it is shared with the m/z = 45 mass fragment (blue). d) TPD curves of the m/z = 43 mass fragment, corresponding to the CH3CO+ fragment of CH3CHO. The desorption peaking at ~116 K (dashed line) confirms the formation of acetaldehyde during UV photoprocessing of a pure ethanol ice (see text).
fragment of C2H6. A desorption peak at ~75 K (dashed line) confirms the presence of ethane in the processed ethanol ice (desorption of a pure ethane ice takes place above 60 K according to Öberg et al. 2009). b) TPD curves of the m/z = 30 mass fragment, corresponding to the molecular ion of H2CO. The desorption peaking at ~121 K (dashed line) confirms the formation of formaldehyde during UV photoprocessing of a pure ethanol ice (see text). c) TPD curves of the m/z = 31 mass fragment corresponding to the CH3O+ fragment of CH3OH. Since no excess in the desorption is detected at ~145 K compared to the blank, formation of methanol during UV photoprocessing of a pure ethanol ice is negligible. Desorption at ~127 K (dashed line) is probably due to an earlier ethanol desorption triggered by less polar and more volatile components in the ice matrix that were not present in the blank experiment (mainly formaldehyde and acetaldehyde), since it is shared with the m/z = 45 mass fragment (blue). d) TPD curves of the m/z = 43 mass fragment, corresponding to the CH3CO+ fragment of CH3CHO. The desorption peaking at ~116 K (dashed line) confirms the formation of acetaldehyde during UV photoprocessing of a pure ethanol ice (see text).
Current usage metrics show cumulative count of Article Views (full-text article views including HTML views, PDF and ePub downloads, according to the available data) and Abstracts Views on Vision4Press platform.
Data correspond to usage on the plateform after 2015. The current usage metrics is available 48-96 hours after online publication and is updated daily on week days.
Initial download of the metrics may take a while.