Fig. 3
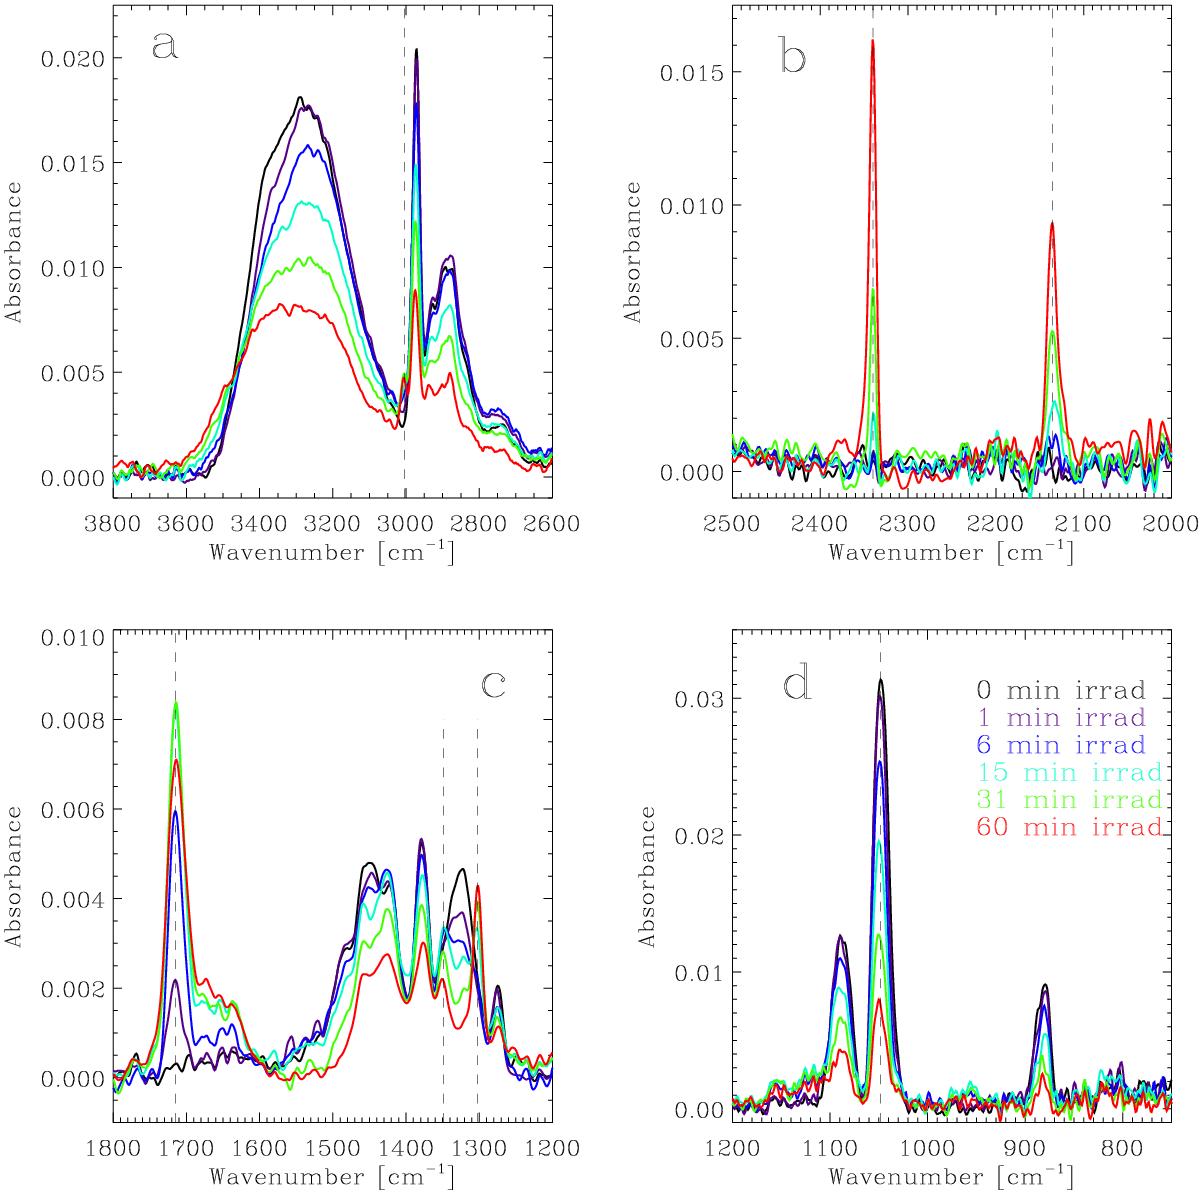
Evolution of the IR spectrum of the ice sample during UV photoprocessing in experiment 2 (see Table 3) conveniently split in four regions. Results were similar in experiment 1. a) A new feature appears at 3005 cm-1 (dashed line) between the O-H and C-H stretching bands of C2H5OH, which is attributed to the formation of CH4. This species also displays a more intense band near 1302 cm-1, shown in panel c). b) Formation of CO2 and CO leads to the appearance of two C-O stretching bands at 2340 cm-1 and 2136 cm-1 (dashed lines), respectively. c) Dashed lines at 1715 cm-1, 1349 cm-1, and 1302 cm-1 indicate new features due to the formation of photoproducts (probably H2CO, CH3CHO, C2H6, and CH4; see text). A broad band on the red side of the 1715 cm-1 peak may indicate the presence of H2O. d) Intensity of the C-O stretching band of C2H5OH at 1048 cm-1 (dashed line) decreases as the ice is processed.
Current usage metrics show cumulative count of Article Views (full-text article views including HTML views, PDF and ePub downloads, according to the available data) and Abstracts Views on Vision4Press platform.
Data correspond to usage on the plateform after 2015. The current usage metrics is available 48-96 hours after online publication and is updated daily on week days.
Initial download of the metrics may take a while.