Fig. 8
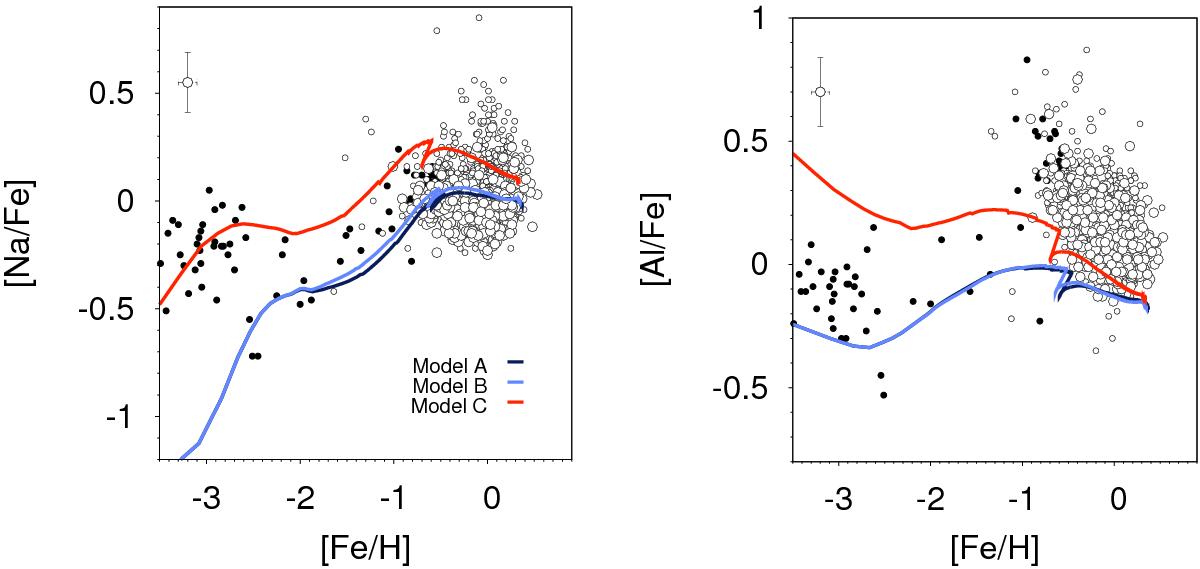
Runs of [Na/Fe] (left panel) and [Al/Fe] (right panel) with [Fe/H] predicted by chemical evolution models for the solar neighborhood adopting different stellar yields (see text; legend on the lower right corner of the left panel). Data for low-metallicity stars (filled circles) are from Gehren et al. (2006), Andrievsky et al. (2007, for Na only), and Andrievsky et al. (2008, for Al only). High-quality data for our sample dwarfs (selected as in Sect. 2.3) are shown as large empty circles, while the small empty circles refer to the full sample, including lower quality data and giants. All measured Na abundances were corrected for non-LTE effects. Typical error bars are ~0.15 dex for [El/Fe] and ~0.10 dex for [Fe/H] in this and all following plots. A typical error bar (±0.10 dex for [Elem./H] and ±0.14 dex for [Elem./Fe] is shown in the upper left of each panel.)
Current usage metrics show cumulative count of Article Views (full-text article views including HTML views, PDF and ePub downloads, according to the available data) and Abstracts Views on Vision4Press platform.
Data correspond to usage on the plateform after 2015. The current usage metrics is available 48-96 hours after online publication and is updated daily on week days.
Initial download of the metrics may take a while.