Fig. 4
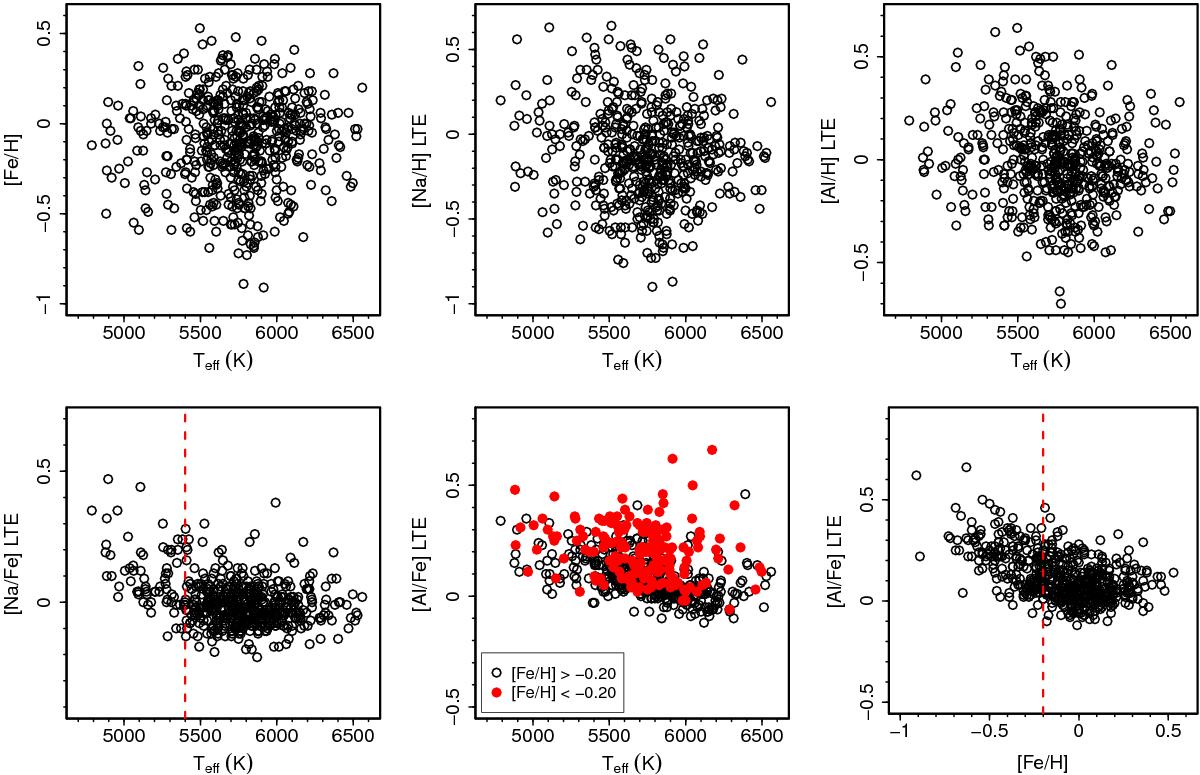
Trends between abundances and atmospheric parameters in the dwarfs of the sample. Upper left: no apparent trend between [Fe/H] and Teff (correlation coefficient ρ = 0.03, with p value = 0.49). Upper middle: weak trend between [Na/H] and Teff (ρ = −0.09, with p value = 0.03). Upper right: weak trend between [Al/H] and Teff (ρ = −0.17, with p value close to zero). Lower left: a moderate trend (ρ = −0.34, with p value close to zero) between [Na/Fe] and Teff appears for stars cooler than 5400 K (red dashed line). Lower middle: a moderate trend between [Al/Fe] and Teff (ρ = −0.37, with p value close to zero). In red circles, we show the stars with [Fe/H] <−0.20 selected to understand whether the correlation with Teff would affect the chemical evolution discussion. Lower right: the trend between [Al/Fe] and [Fe/H] thought to appear from the Galactic chemical evolution. We selected the stars with [Fe/H] <−0.20 (left of the red dashed line) to test whether they are the stars mainly affected by the correlation of [Al/Fe] with Teff.
Current usage metrics show cumulative count of Article Views (full-text article views including HTML views, PDF and ePub downloads, according to the available data) and Abstracts Views on Vision4Press platform.
Data correspond to usage on the plateform after 2015. The current usage metrics is available 48-96 hours after online publication and is updated daily on week days.
Initial download of the metrics may take a while.