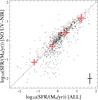
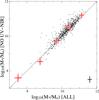
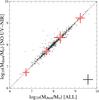
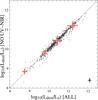
Fig. 6

SFR (top left panel), M∗ (top right), Mdust (bottom left), and Ldust (bottom right panel) obtained from the main sample (abscissa) and the extended sample (ordinate). The dashed line shows a linear relation between the two quantities. Red circles show the median calculated inside bin evenly spaced with associated variance. Average errors are shown in the bottom right corner.
Current usage metrics show cumulative count of Article Views (full-text article views including HTML views, PDF and ePub downloads, according to the available data) and Abstracts Views on Vision4Press platform.
Data correspond to usage on the plateform after 2015. The current usage metrics is available 48-96 hours after online publication and is updated daily on week days.
Initial download of the metrics may take a while.