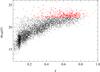
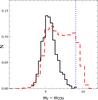
Fig. 3

Top panel: r-band AB magnitude as a function of z for the extended sample. Red circles represents the galaxies with mr> 22.2 excluded from the sample because of incompleteness. Bottom panel: normalized histograms of the mr − m250 index for the main (black solid line) and extended (red dashed line) sample. The vertical blue dotted line shows the color limit considering both r-band and 250 μm detection limits.
Current usage metrics show cumulative count of Article Views (full-text article views including HTML views, PDF and ePub downloads, according to the available data) and Abstracts Views on Vision4Press platform.
Data correspond to usage on the plateform after 2015. The current usage metrics is available 48-96 hours after online publication and is updated daily on week days.
Initial download of the metrics may take a while.