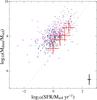
Fig. 11

Dust mass (Mdust) vs. SFR for the main sample. Red crosses show the results of Smith et al. (2012) for a sample of ~1400 objects selected at 250 μm from the H-ATLAS survey (Eales et al. 2010) at z< 0.5. The dashed line shows the best fit obtained in da Cunha et al. (2010) from a sample of about ~1700 low redshift galaxies. Blue triangles and the magenta circles show two subsamples of approximately the same size with M∗< 5 × 10⁹ M⊙ and M∗> 5 × 10¹⁰ M⊙, respectively. The cross in the bottom right corner shows the average error.
Current usage metrics show cumulative count of Article Views (full-text article views including HTML views, PDF and ePub downloads, according to the available data) and Abstracts Views on Vision4Press platform.
Data correspond to usage on the plateform after 2015. The current usage metrics is available 48-96 hours after online publication and is updated daily on week days.
Initial download of the metrics may take a while.