Fig. 8
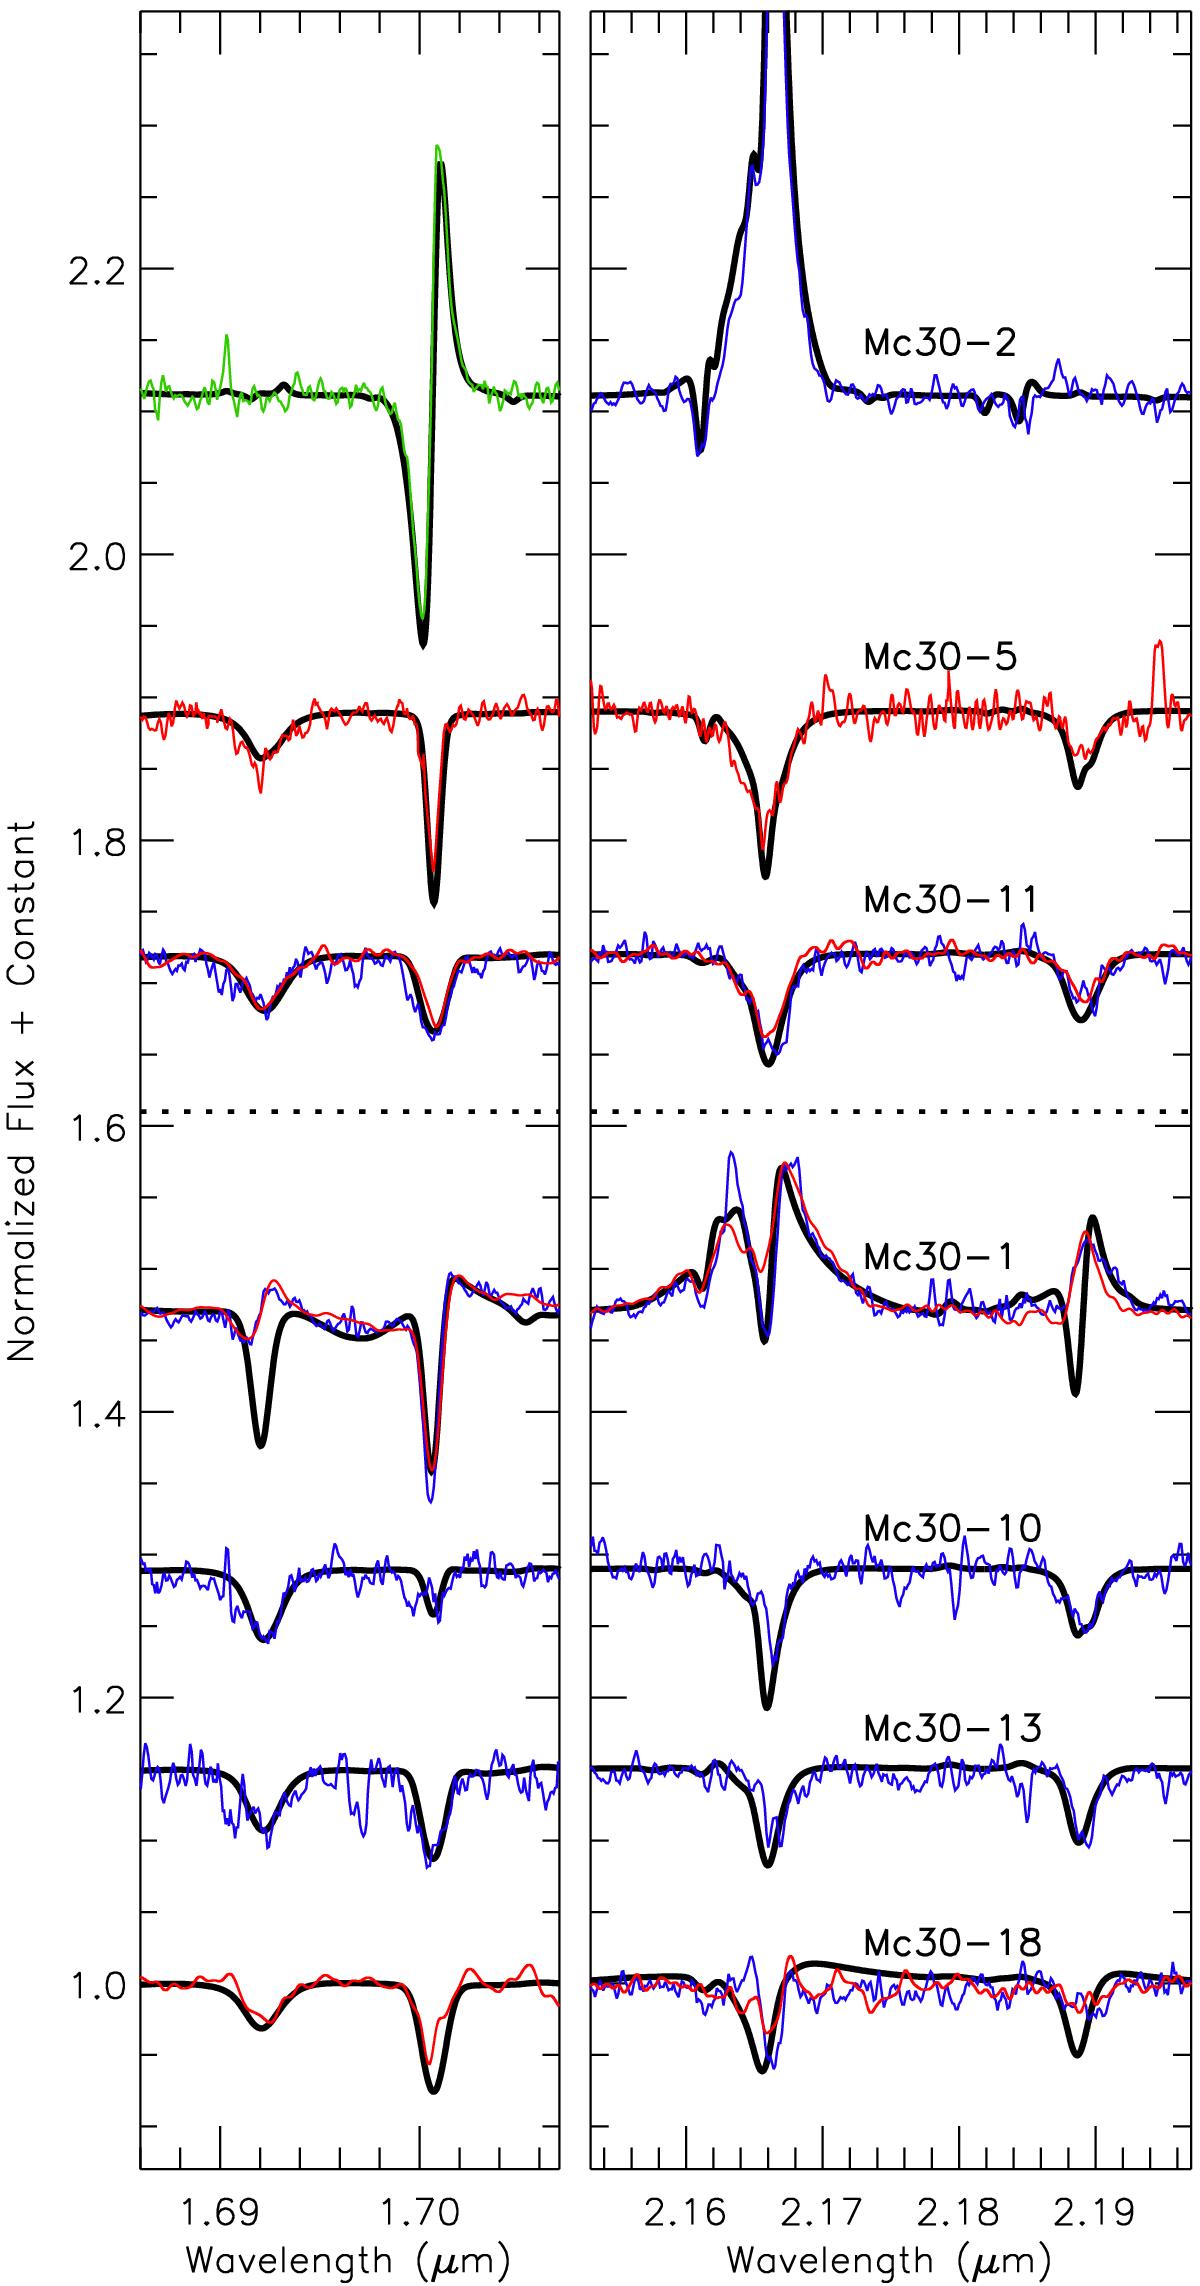
Relevant portions of example models (black lines) fitted to observations (color code of Fig. 3). The full plots are shown in Figs. A.1 and A.2. Unlike Fig. 3, radial velocities of observed spectra have been corrected with the values of Tables 3 and 5, and the higher resolution spectra have been degraded to the lower resolving power when two observations are simultaneously fitted. The observed spectra above the dotted line are well fitted to a single model. Below that line, the spectra show clear signs of binarity (see Sect. 3.5); in these cases, we fit each dominant source.
Current usage metrics show cumulative count of Article Views (full-text article views including HTML views, PDF and ePub downloads, according to the available data) and Abstracts Views on Vision4Press platform.
Data correspond to usage on the plateform after 2015. The current usage metrics is available 48-96 hours after online publication and is updated daily on week days.
Initial download of the metrics may take a while.