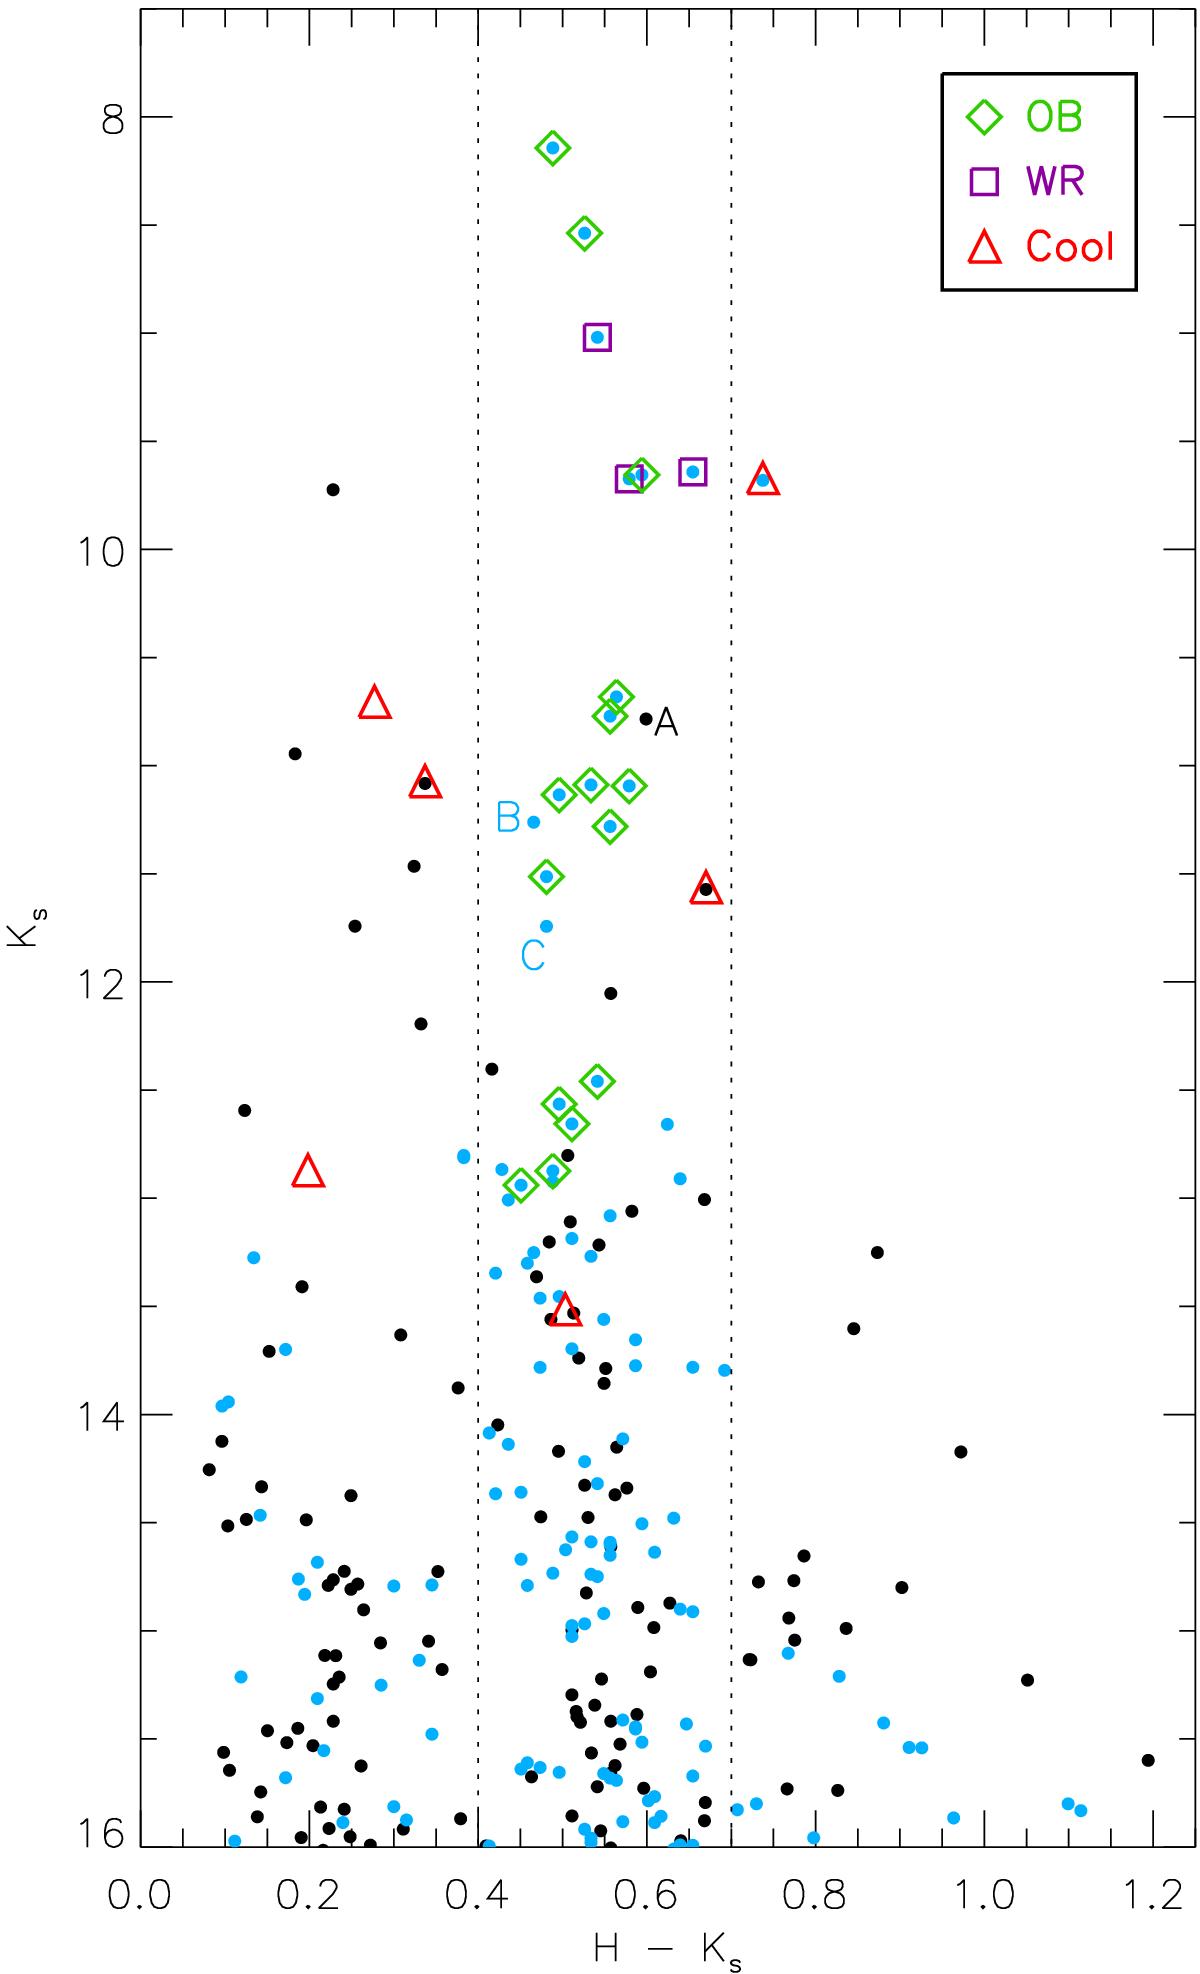
Fig. 7

Color−magnitude diagram of Mercer 30 up to a radius of 45′′, with dotted lines enclosing the color range used for selection of hot massive cluster members. Black dots are VVV data and blue dots are the HST photometric measurements converted to the VVV passbands. Spectroscopically observed objects are highlighted with symbols, even if they are located at r> 45′′. A, B, and C are the three candidate high-luminosity cluster members that will be discussed in Sect. 3.8.
Current usage metrics show cumulative count of Article Views (full-text article views including HTML views, PDF and ePub downloads, according to the available data) and Abstracts Views on Vision4Press platform.
Data correspond to usage on the plateform after 2015. The current usage metrics is available 48-96 hours after online publication and is updated daily on week days.
Initial download of the metrics may take a while.


