Fig. 6
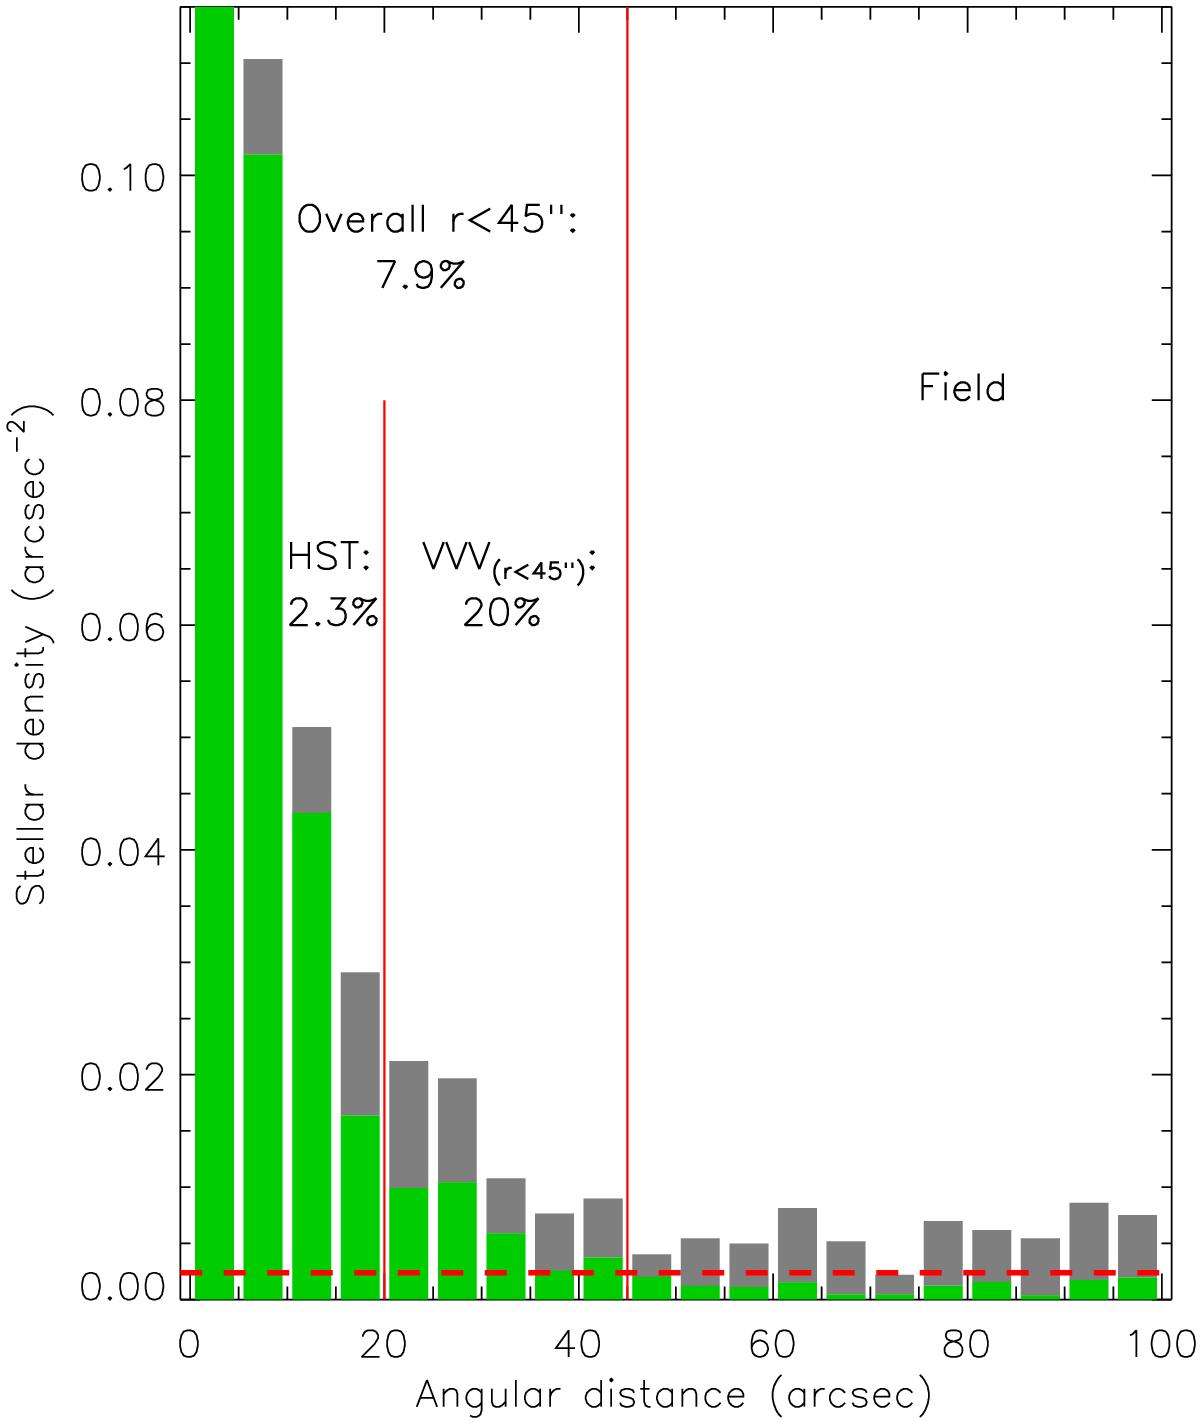
Radial profile of stellar density, centered at RA = 12h14m32.15s, Dec =−62°58′50.1′′ and binned by 5 arcseconds. Gray bars represent the whole population with KS< 15, and green bars show the fraction of these that fall within the color range of OB cluster members (0.4 ≤ H−KS ≤ 0.7). For the sake of clarity, the density values of the first bin (0.2037 and 0.2164) are outside the axis range. The radial cuts for HST and VVV photometry are shown as red vertical lines, and the density limit we use to establish the outer boundary of the cluster is indicated as a red dashed line. For each cluster region, we also provide the probability that a star that fulfills the color cut is actually a contaminant.
Current usage metrics show cumulative count of Article Views (full-text article views including HTML views, PDF and ePub downloads, according to the available data) and Abstracts Views on Vision4Press platform.
Data correspond to usage on the plateform after 2015. The current usage metrics is available 48-96 hours after online publication and is updated daily on week days.
Initial download of the metrics may take a while.