Fig. 5
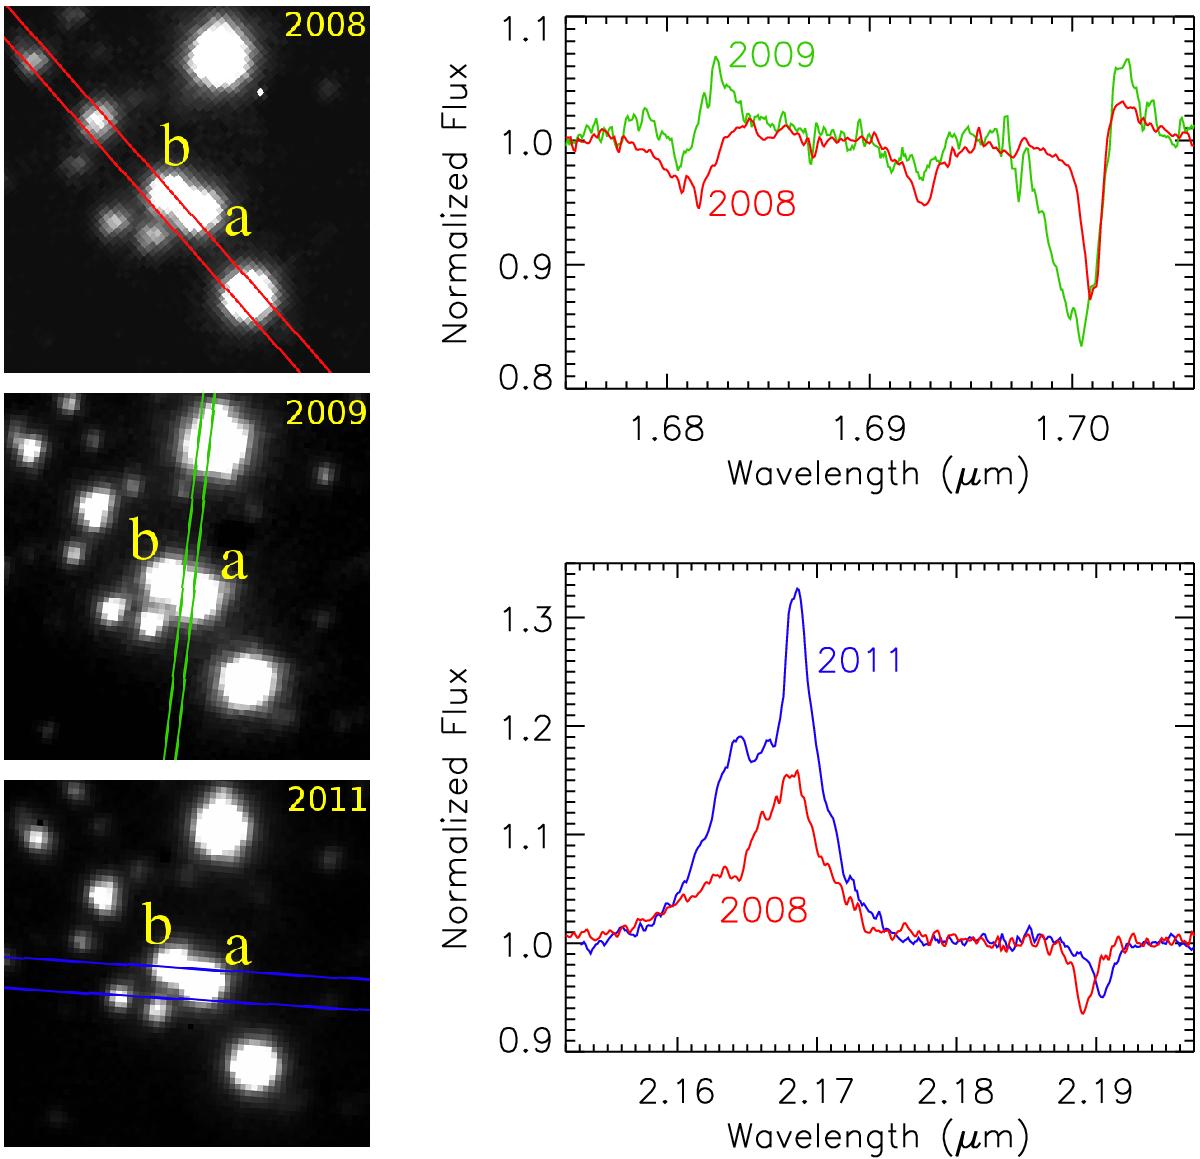
Left: slit positions used for observing Mc30-6, superimposed on 10′′ × 10′′ cut-outs of the corresponding ISAAC acquisition images, where North is up and East is left. The double object close to the center of each image is Mc30-6, and each component is labeled. Right: comparison of the extracted spectra of Mc30-6 at the ranges where variations are more striking. Each spectrum is labeled with the year of observation. Colors are coded as in Fig. 3.
Current usage metrics show cumulative count of Article Views (full-text article views including HTML views, PDF and ePub downloads, according to the available data) and Abstracts Views on Vision4Press platform.
Data correspond to usage on the plateform after 2015. The current usage metrics is available 48-96 hours after online publication and is updated daily on week days.
Initial download of the metrics may take a while.