Fig. 2
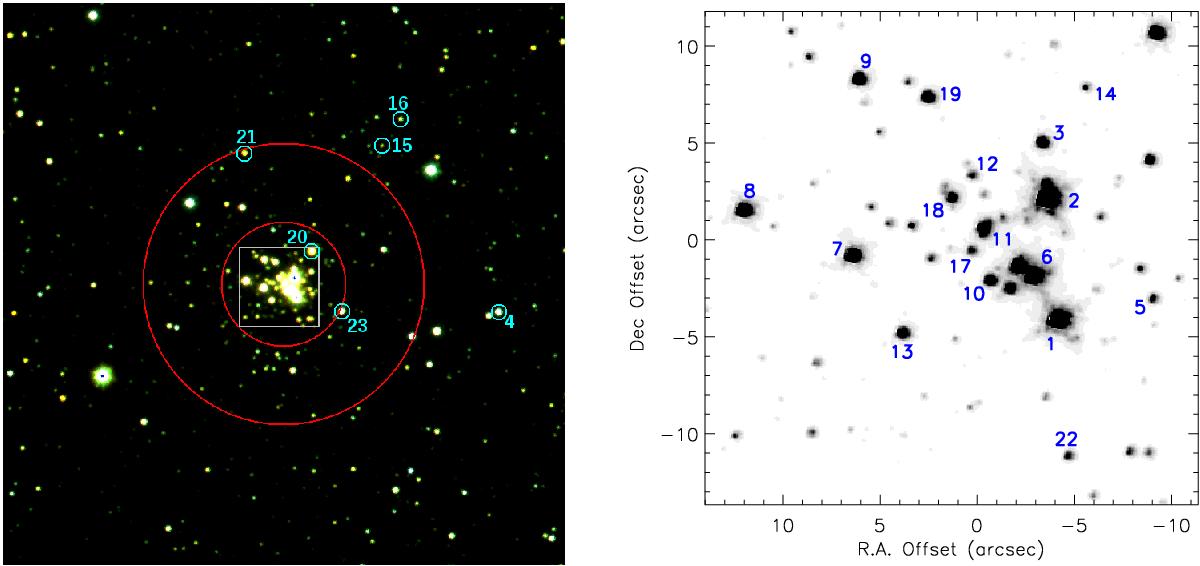
3′ × 3′ RGB image (R = KS, G = H, B = J) of Mercer 30 from the VVV survey (left) and NICMOS/HST close-up view of the central region in the F222M band (right). The spatial coverage of the latter is shown as a gray square on the VVV image. The origin of the coordinate plane in the HST chart corresponds to the center of the VVV image, which is situated at RA = 12h14m32.15s, Dec =−62°58′50.1′′. North is up and east is left. All the spectroscopically observed stars are labeled as identified in Table 2. Confirmed cluster members are shown only in the HST chart and the remaining objects are labeled in the VVV image. Red circles enclose the regions r< 20′′ and 20′′<r< 45′′, where the HST and the VVV photometry, respectively, have been used for cluster characterization (see Sect. 3.2).
Current usage metrics show cumulative count of Article Views (full-text article views including HTML views, PDF and ePub downloads, according to the available data) and Abstracts Views on Vision4Press platform.
Data correspond to usage on the plateform after 2015. The current usage metrics is available 48-96 hours after online publication and is updated daily on week days.
Initial download of the metrics may take a while.