Fig. 6
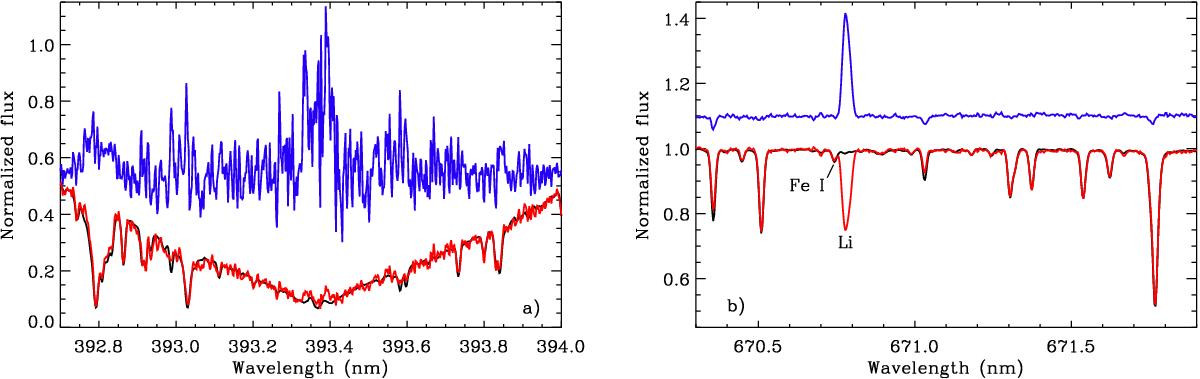
Comparison of the solar spectrum (black) to the spectrum of the solar analog KIC 10644253 observed with the HERMES spectrograph. The regions around the Ca K line and the lithium multiplet at 670.78 nm are respectively shown in the left and right panels. The flux ratio (blue) of the two spectra between KIC 10644253 and the Sun (left), and between the Sun and KIC 10644253 (right) are also shown after shifting them by −0.45 and +0.1 respectively.
Current usage metrics show cumulative count of Article Views (full-text article views including HTML views, PDF and ePub downloads, according to the available data) and Abstracts Views on Vision4Press platform.
Data correspond to usage on the plateform after 2015. The current usage metrics is available 48-96 hours after online publication and is updated daily on week days.
Initial download of the metrics may take a while.