Fig. 4
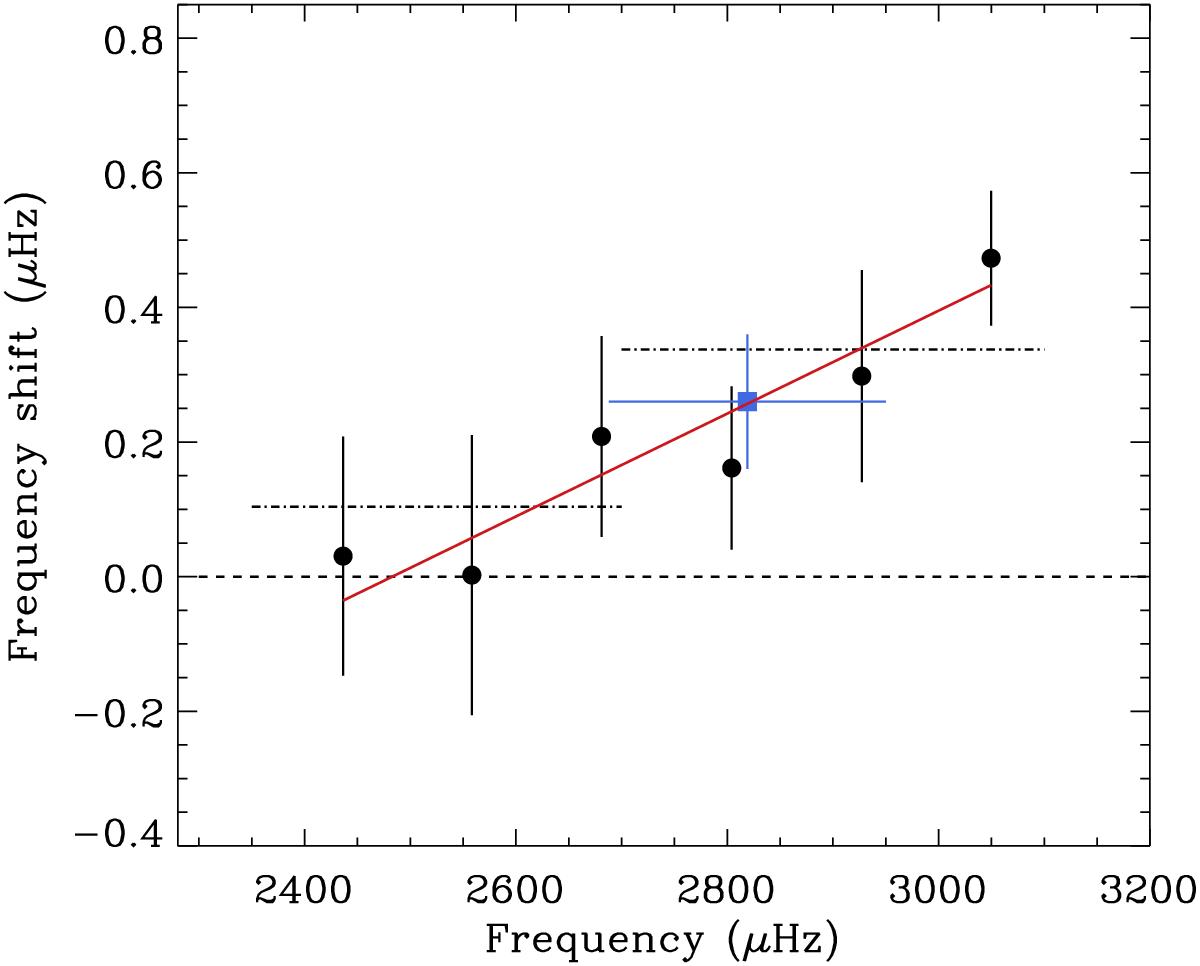
Frequency shifts of the individual l = 1 frequencies (black dots) of KIC 10644253 as a function of frequency. The dot-dashed lines correspond to the weighted averages over two different frequency ranges represented by the total length of the lines, while the red solid line corresponds to a weighted linear fit. The blue square corresponds to the modeled value of the frequency shift at νmax (see Sect. 6 and Table 1).
Current usage metrics show cumulative count of Article Views (full-text article views including HTML views, PDF and ePub downloads, according to the available data) and Abstracts Views on Vision4Press platform.
Data correspond to usage on the plateform after 2015. The current usage metrics is available 48-96 hours after online publication and is updated daily on week days.
Initial download of the metrics may take a while.