Fig. 3
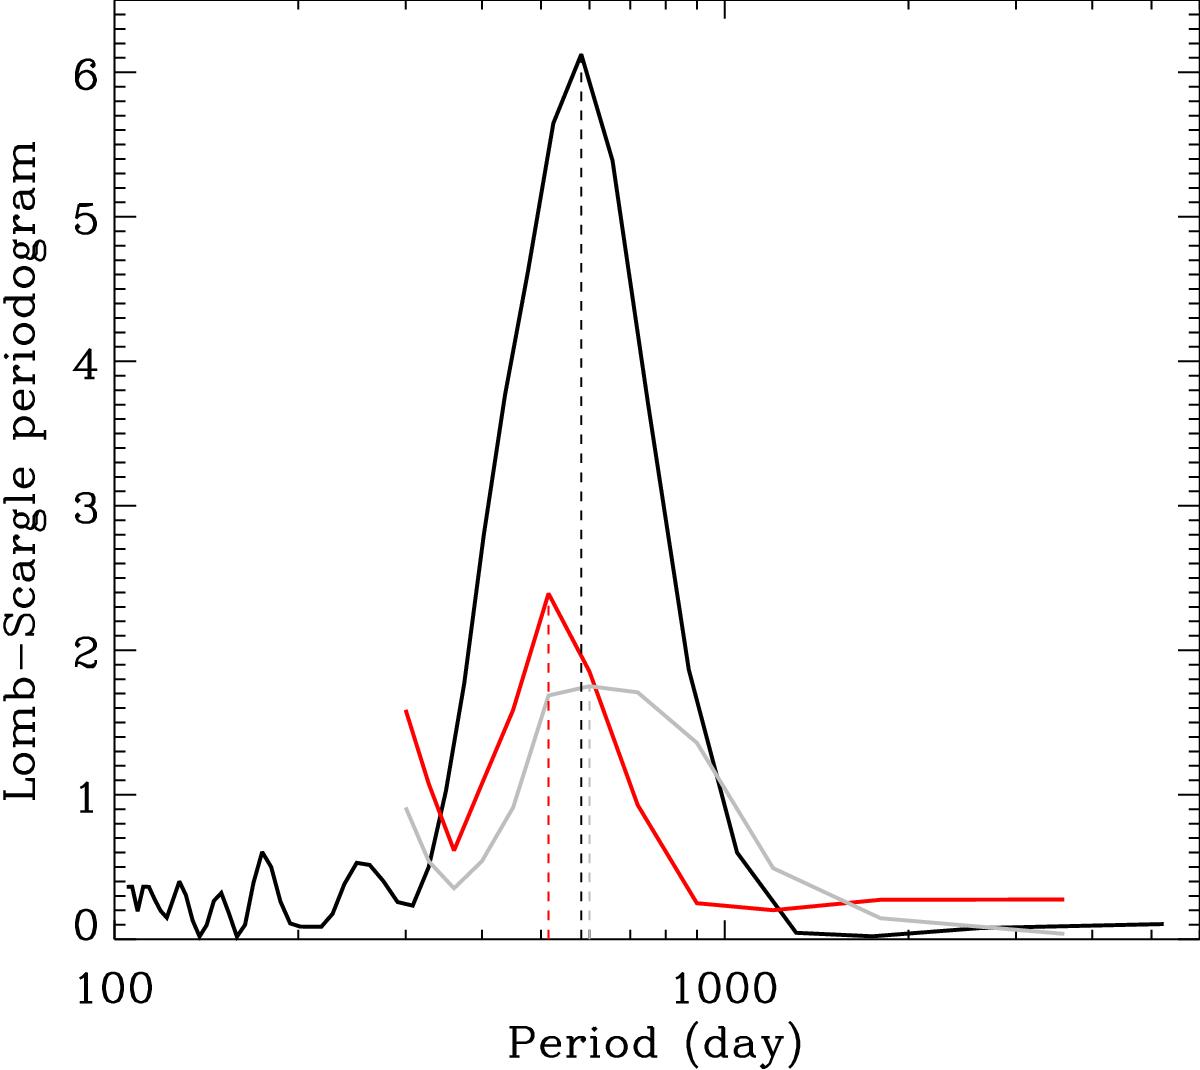
Lomb-Scargle periodograms of the photometric activity proxy Sph (black) and of the frequency shifts of the individual l = 0 (gray) and l = 1 (red) modes extracted from the analysis of KIC 10644253 using Method #2. Only independent points were used. The vertical dashed lines correspond to the associated maximum of the periodograms.
Current usage metrics show cumulative count of Article Views (full-text article views including HTML views, PDF and ePub downloads, according to the available data) and Abstracts Views on Vision4Press platform.
Data correspond to usage on the plateform after 2015. The current usage metrics is available 48-96 hours after online publication and is updated daily on week days.
Initial download of the metrics may take a while.